Business Plus Benefit
Book a callinfo@businessplusbenefit.com

FinTech studies

Studies that decisions can stand on.

Directives and procedures, IPSAS gap analyses, accounting solutions compared, break-even analyses, medium-term financial plans, risk frameworks and white papers. Written by people who have put them to work in a NATO financial environment, and documented so that boards, auditors and funders can rely on them.

Book a call

Business Plus Benefit Research · October 2026

The Price of Readiness

Live and Synthetic Training, Attrition and the Financing of Allied Defence

What does a unit of combat readiness cost when it is produced in the air, on the range, in the simulator or in a blend of all three? This paper brings together the evidence on cost, on the transfer of training and on attrition in the wars in Ukraine and the Middle East.

It compares how NATO, the European Union and fifteen states train, examines how the new 5 % commitment will be financed and accounted for, and sets out quantified recommendations for allied training policy to 2035.

Ask about this research

162 pages; a selection of them turns in the reader.

  • 0.45

    Median transfer effectiveness ratio of simulator training in the classic studies

  • 44%

    Saving in marginal costs from delivering half of a fighter pilot’s training synthetically (central case)

  • 1,200

    PAC-3 interceptors estimated to have been used against Iran in 2026, more than three times FY2026 purchases

  • 11

    Recommendations for NATO and the European Union

Turn the pages of a white paper

The library

Eight kinds of study, one standard.

Open a book to see what it covers and how its pages look.

Research

White Papers

Papers on sustainability and going concern, creditworthiness and performance indicators, written to be read by decision makers.

What it covers

  • Sustainability and going concern
  • Creditworthiness
  • Key performance indicators
  • Medium-term financial strategy and financial risk management
Ask about this study

i

Resilient by design: from the white paper on medium-term financial strategy and financial risk management.

Turn its pages

ii

Governance

Internal Directives

Budgetary, accounting and procurement directives, written for the people who apply them.

What it covers

  • Budget preparation, execution and transfers
  • Commitments, approvals and payments
  • Procurement thresholds and delegations
  • Year-end closing and records

Ask about this study

i

Preview

Directive on the commitment of funds

  1. 1. Purpose and scope3
  2. 2. Roles: originator, financial controller, approving authority7
  3. 3. Raising a request for commitment11
  4. 4. Certification of funds available15
  5. 5. Approval and recording19
  6. 6. Release of unused commitments23
  7. Annex A: forms and records27

Illustrative contents. Studies are written for each client and stay theirs.

ii

Regulations

Financial Administrative Procedures

Procedures and regulations aligned with the rules you answer to, from NATO financial regulations to national law.

What it covers

  • Financial rules mapped to daily procedures
  • Segregation of duties and approval matrices
  • Cash, bank and asset management
  • Internal control and audit trail

Ask about this study

i

Preview

Financial Administrative Procedures

  1. Chapter 1. General provisions3
  2. Chapter 2. The budget cycle7
  3. Chapter 3. Commitments and expenditure11
  4. Chapter 4. Revenue and contributions15
  5. Chapter 5. Treasury and banking19
  6. Chapter 6. Assets and inventory23
  7. Chapter 7. Accounting and reporting27

Illustrative contents. Studies are written for each client and stay theirs.

ii

IPSAS

IPSAS Migration and Gap Analysis

Where your accounting stands against IPSAS today, and the phased path to full accrual.

What it covers

  • Standard by standard gap analysis
  • Opening balances under IPSAS 33
  • Policy choices for approval
  • A phased migration plan

Ask about this study

i

Preview

Readiness review: gaps against IPSAS

  1. IPSAS 1 Presentation of financial statements3
  2. IPSAS 2 Cash flow statements7
  3. IPSAS 17 Property, plant and equipment11
  4. IPSAS 19 Provisions and contingencies15
  5. IPSAS 23 Revenue from non-exchange transactions19
  6. IPSAS 33 First-time adoption23
  7. IPSAS 39 Employee benefits27

Illustrative contents. Studies are written for each client and stay theirs.

ii

Systems

Accounting Solutions SWOT Analysis

Accounting software options weighed for your rules, your team and your budget, before you commit.

What it covers

  • Strengths, weaknesses, opportunities and threats
  • Fit against your reporting framework
  • Total cost of ownership
  • A recommendation you can defend

Ask about this study

i

Preview

SWOT: accounting solutions compared

  1. Strengths: accrual ledger, multi-currency, audit trail3
  2. Weaknesses: workflow and approvals out of the box7
  3. Opportunities: custom tools, cloud hosting11
  4. Threats: vendor lock-in, data residency15
  5. Scoring matrix, by criterion and weight19
  6. Recommendation and conditions23

Illustrative contents. Studies are written for each client and stay theirs.

ii

Economics

Break-even Analysis

Fixed and variable costs, contribution margins and the point where a service or a business pays for itself.

What it covers

  • Cost structure: fixed and variable
  • Contribution margin by service
  • Break-even volume and price
  • Sensitivity to the key assumptions

Ask about this study

i

Preview

Break-even: when the service pays for itself

  1. Fixed costs per year3
  2. Variable cost per unit7
  3. Price per unit11
  4. Contribution margin15
  5. Break-even volume19
  6. Margin of safety23
  7. Sensitivity: price, volume, cost27

Illustrative contents. Studies are written for each client and stay theirs.

ii

Strategy

Medium-Term Financial Planning

Tools and methodologies for the medium-term financial plan and strategy: scenarios, forecasts and the rules that hold them.

What it covers

  • Multi-year financial plan and scenarios
  • Contribution and expenditure forecasts
  • Reserves policy and sustainability
  • Governance of the strategy

Ask about this study

i

Preview

Medium-term financial plan

  1. Baseline: contributions and commitments3
  2. Scenario A: steady programme of work7
  3. Scenario B: growth in requests for support11
  4. Scenario C: a shortfall in contributions15
  5. Reserves and liquidity, year by year19
  6. Decisions for the steering committee23

Illustrative contents. Studies are written for each client and stay theirs.

ii

Risk

Financial Risk Management

Financial risks identified, assessed and treated, with an appetite the governing body has approved.

What it covers

  • A taxonomy of financial risk
  • Likelihood and impact, scored
  • Risk appetite and tolerances
  • Treatment, monitoring and reporting

Ask about this study

i

Preview

Financial risk register

  1. Contributions received late3
  2. Commitments above the budget line7
  3. Liquidity below the minimum11
  4. Currency and price movements15
  5. Fraud and error19
  6. Treatment owner and review date23

Illustrative contents. Studies are written for each client and stay theirs.

ii

Featured white paper

Resilient by design.

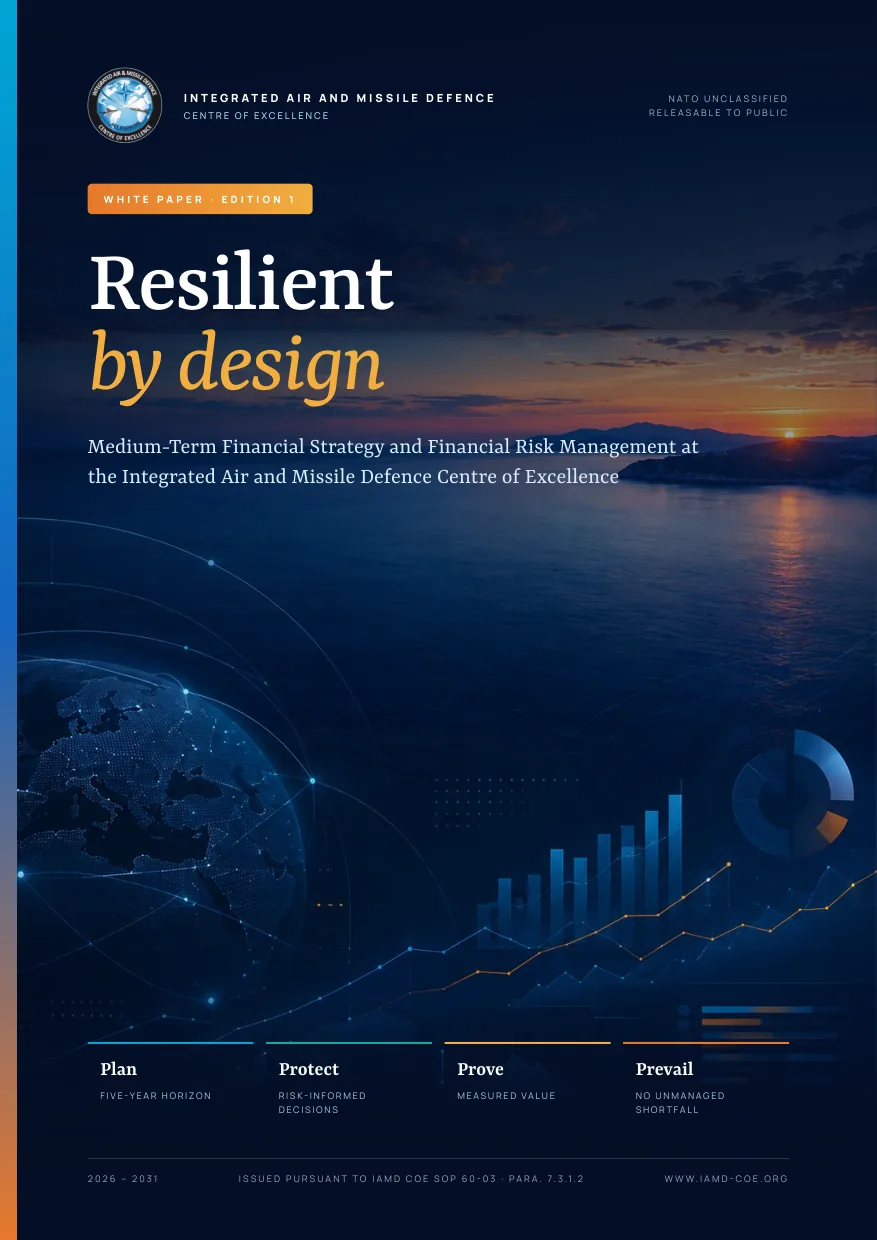
Medium-term financial strategy and financial risk management for a NATO-accredited Centre of Excellence: a statement of intent turned into a working system of plans, controls and indicators. Turn its pages.
White paper page: Cover

Text of this page:

INTEGRATED AIR AND MISSILE DEFENCE NATO UNCLASSIFIED RELEASABLE TO PUBLIC WHITE PAPER · EDITION 1 Resilient by design Medium-Term Financial Strategy and Financial Risk Management at the Integrated Air and Missile Defence Centre of Excellence Plan FIVE-YEAR HORIZON Protect RISK-INFORMED DECISIONS Prove MEASURED VALUE Prevail NO UNMANAGED SHORTFALL 2026 - 2031 ISSUED PURSUANT TO IAMD COE SOP 60-03 · PARA. 7.3.1.2 WWW.IAMD-COE.ORG CENTRE OF EXCELLENCE
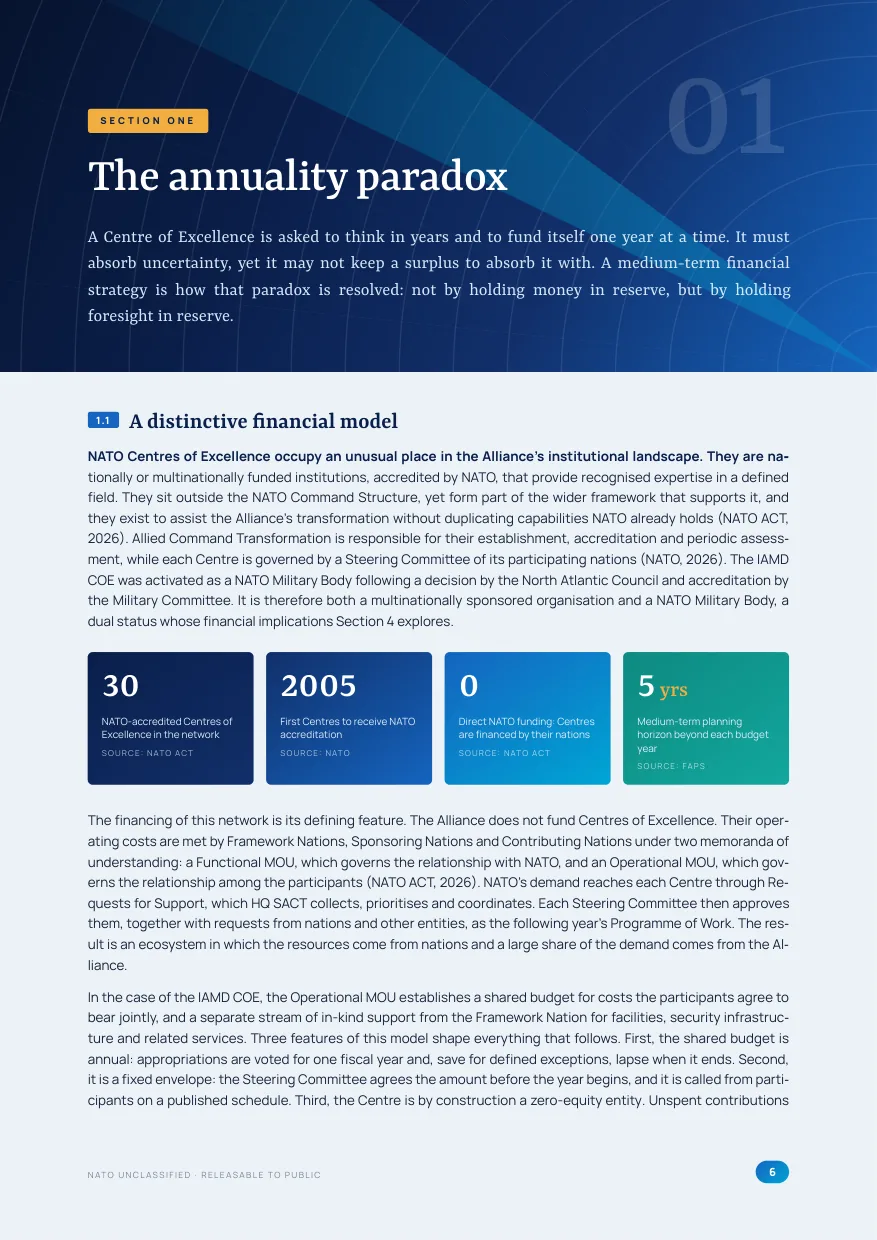
White paper page: 01 The annuity paradox

Text of this page:

1.1 A distinctive financial model NATO Centres of Excellence occupy an unusual place in the Alliance’s institutional landscape. They are nationally or multinationally funded institutions, accredited by NATO, that provide recognised expertise in a defined field. They sit outside the NATO Command Structure, yet form part of the wider framework that supports it, and they exist to assist the Alliance’s transformation without duplicating capabilities NATO already holds (NATO ACT, 2026). Allied Command Transformation is responsible for their establishment, accreditation and periodic assessment, while each Centre is governed by a Steering Committee of its participating nations (NATO, 2026). The IAMD COE was activated as a NATO Military Body following a decision by the North Atlantic Council and accreditation by the Military Committee. It is therefore both a multinationally sponsored organisation and a NATO Military Body, a dual status whose financial implications Section 4 explores.

30 NATO-accredited Centres of Excellence in the network SOURCE: NATO ACT 2005 First Centres to receive NATO accreditation SOURCE: NATO 0 Direct NATO funding: Centres are financed by their nations SOURCE: NATO ACT 5 yrs Medium-term planning horizon beyond each budget year SOURCE: FAPS The financing of this network is its defining feature. The Alliance does not fund Centres of Excellence. Their operating costs are met by Framework Nations, Sponsoring Nations and Contributing Nations under two memoranda of understanding: a Functional MOU, which governs the relationship with NATO, and an Operational MOU, which governs the relationship among the participants (NATO ACT, 2026). NATO’s demand reaches each Centre through Requests for Support, which HQ SACT collects, prioritises and coordinates. Each Steering Committee then approves them, together with requests from nations and other entities, as the following year’s Programme of Work. The result is an ecosystem in which the resources come from nations and a large share of the demand comes from the Alliance.

In the case of the IAMD COE, the Operational MOU establishes a shared budget for costs the participants agree to bear jointly, and a separate stream of in-kind support from the Framework Nation for facilities, security infrastructure and related services. Three features of this model shape everything that follows. First, the shared budget is annual: appropriations are voted for one fiscal year and, save for defined exceptions, lapse when it ends. Second, it is a fixed envelope: the Steering Committee agrees the amount before the year begins, and it is called from participants on a published schedule. Third, the Centre is by construction a zero-equity entity. Unspent contributions SECTION ONE The annuality paradox A Centre of Excellence is asked to think in years and to fund itself one year at a time. It must absorb uncertainty, yet it may not keep a surplus to absorb it with. A medium-term financial strategy is how that paradox is resolved: not by holding money in reserve, but by holding foresight in reserve.

01 NATO UNCLASSIFIED · RELEASABLE TO PUBLIC 6
White paper page: Annuity, fixed envelope, zero equity

Text of this page:

Annuality DESIGNCHOICE Appropriationsarevotedforone yearandlapseatitsend.

CONSEQUENCE Multi-yearwork(research, simulation,facilities,systems) outlivesthebudgetthatstarts it.

FRAMEWORKRESPONSE Five-yearMTFPderivedfromthe MTOP;plannedcarry-forward withintherules.

Fixedenvelope DESIGNCHOICE Contributionsareagreedbefore theyearandcalledonaschedule.

CONSEQUENCE RequestsforSupportandprice shocksarriveaftertheenvelope isset.

FRAMEWORKRESPONSE Built-inheadroom;transfers withindelegatedlimits;SC routefortherest.

Zeroequity DESIGNCHOICE Unspentfundsandrevenueare returned;nosurplusisretained.

CONSEQUENCE Thereisnobalance-sheetreserve toabsorbtheunexpected.

FRAMEWORKRESPONSE Riskidentifiedearly;

liquiditymanaged;shortfalls escalatedpromptly.

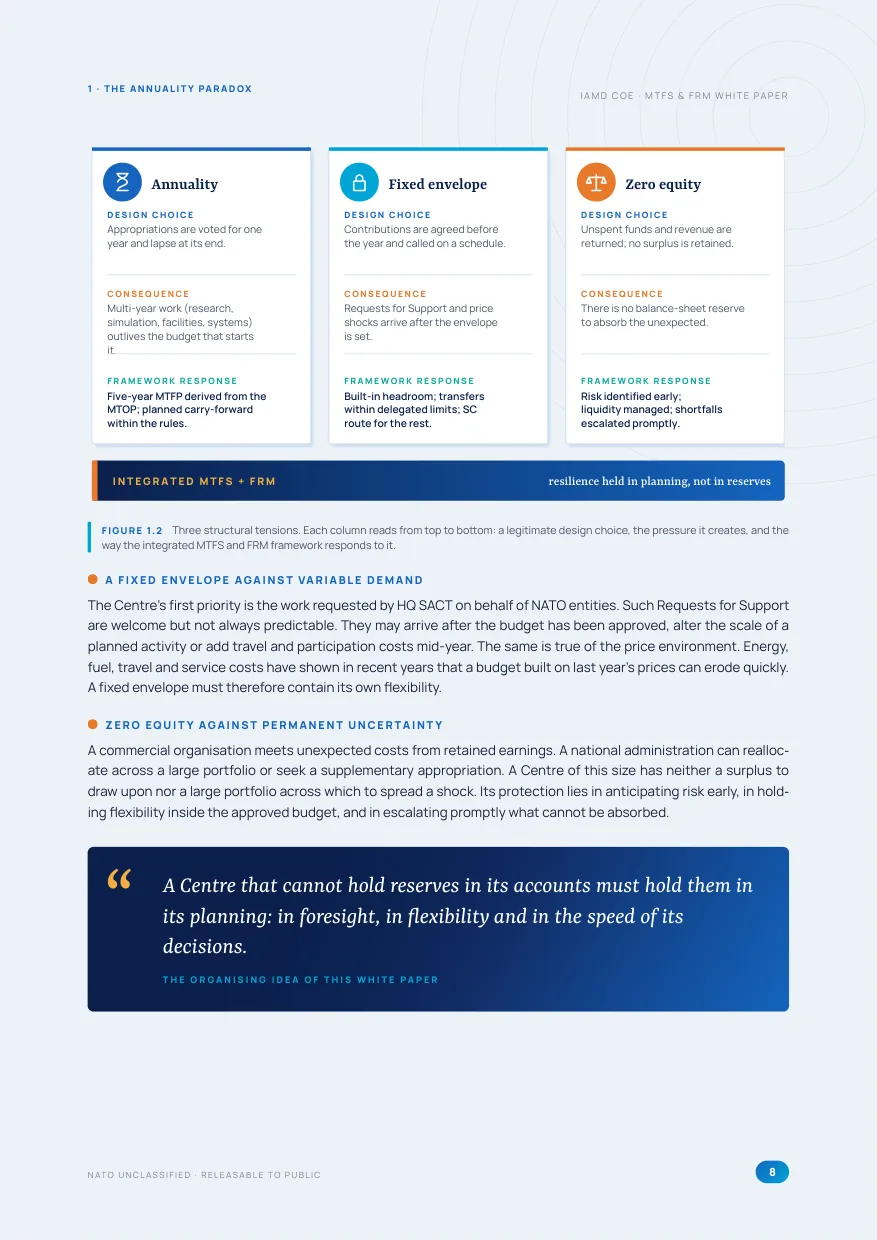
INTEGRATEDMTFS+FRM resilienceheldinplanning,notinreserves FIGURE 1.2 Three structural tensions. Each column reads from top to bottom: a legitimate design choice, the pressure it creates, and the way the integrated MTFS and FRM framework responds to it.

A FIXED ENVELOPE AGAINST VARIABLE DEMAND The Centre’s first priority is the work requested by HQ SACT on behalf of NATO entities. Such Requests for Support are welcome but not always predictable. They may arrive after the budget has been approved, alter the scale of a planned activity or add travel and participation costs mid-year. The same is true of the price environment. Energy, fuel, travel and service costs have shown in recent years that a budget built on last year’s prices can erode quickly.

A fixed envelope must therefore contain its own flexibility.

ZERO EQUITY AGAINST PERMANENT UNCERTAINTY A commercial organisation meets unexpected costs from retained earnings. A national administration can reallocate across a large portfolio or seek a supplementary appropriation. A Centre of this size has neither a surplus to draw upon nor a large portfolio across which to spread a shock. Its protection lies in anticipating risk early, in holding flexibility inside the approved budget, and in escalating promptly what cannot be absorbed.

A Centre that cannot hold reserves in its accounts must hold them in its planning: in foresight, in flexibility and in the speed of its decisions.

THE ORGANISING IDEA OF THIS WHITE PAPER “ 1 · THE ANNUALITY PARADOX IAMD COE · MTFS & FRM WHITE PAPER NATO UNCLASSIFIED · RELEASABLE TO PUBLIC 8
White paper page: 03 Strategic intent and pillars

Text of this page:

3.1 Statement of intent The purpose of the Centre’s Medium-Term Financial Strategy is simple to state and demanding to achieve:

every NATO request the Centre accepts is delivered within the resources its participants have agreed, every euro can be traced to the purpose for which it was contributed, and no resource shortfall is left unmanaged.

The first element expresses the priority the Operational MOU gives to work requested by HQ SACT on behalf of NATO entities. The second expresses stewardship. The third expresses the core aim of IAMD COE SOP 60-03: that critical shortfalls are identified, assessed, prioritised, mitigated and communicated to those who need to know (SOP 60-03).

This intent is deliberately modest in tone and ambitious in substance. It makes no promise of growth for its own sake and sets no target for the size of the budget. It commits the Centre instead to a quality of financial management in which ambition is matched by resources, resources are matched by evidence, and both are open to scrutiny.

3.2 Six guiding principles The principles below are the tests every financial proposal must pass, whatever its size. They draw on international good practice in public financial management (OECD, 2015; CIPFA, 2019) and are consistent with the Centre’s Financial Administrative Procedures.

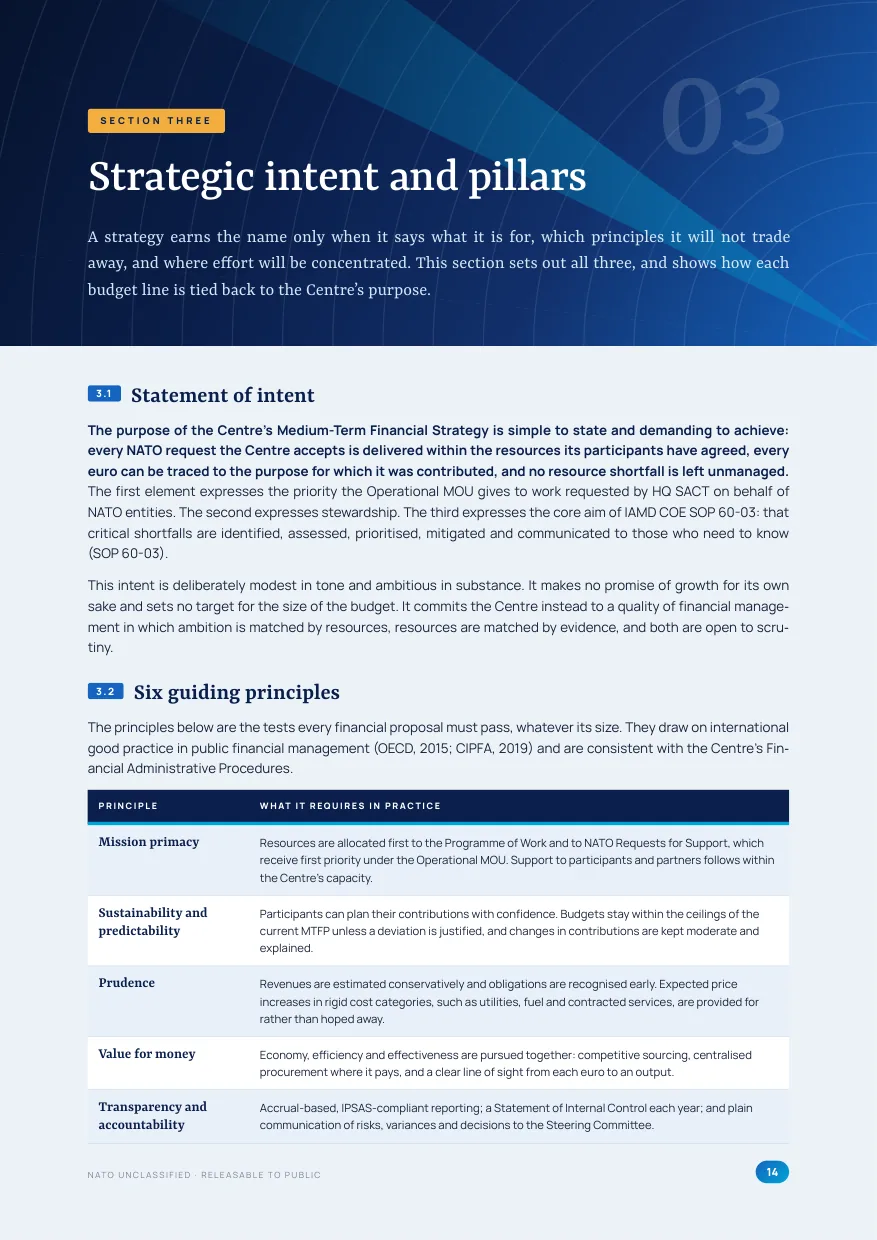
PRINCIPLE WHAT IT REQUIRES IN PRACTICE Mission primacy Resources are allocated first to the Programme of Work and to NATO Requests for Support, which receive first priority under the Operational MOU. Support to participants and partners follows within the Centre’s capacity.

Sustainability and predictability Participants can plan their contributions with confidence. Budgets stay within the ceilings of the current MTFP unless a deviation is justified, and changes in contributions are kept moderate and explained.

Prudence Revenues are estimated conservatively and obligations are recognised early. Expected price increases in rigid cost categories, such as utilities, fuel and contracted services, are provided for rather than hoped away.

Value for money Economy, efficiency and effectiveness are pursued together: competitive sourcing, centralised procurement where it pays, and a clear line of sight from each euro to an output.

Transparency and accountability Accrual-based, IPSAS-compliant reporting; a Statement of Internal Control each year; and plain communication of risks, variances and decisions to the Steering Committee.

SECTION THREE Strategic intent and pillars A strategy earns the name only when it says what it is for, which principles it will not trade away, and where effort will be concentrated. This section sets out all three, and shows how each budget line is tied back to the Centre’s purpose.

03 NATO UNCLASSIFIED · RELEASABLE TO PUBLIC 14
White paper page: Five pillars of delivery

Text of this page:

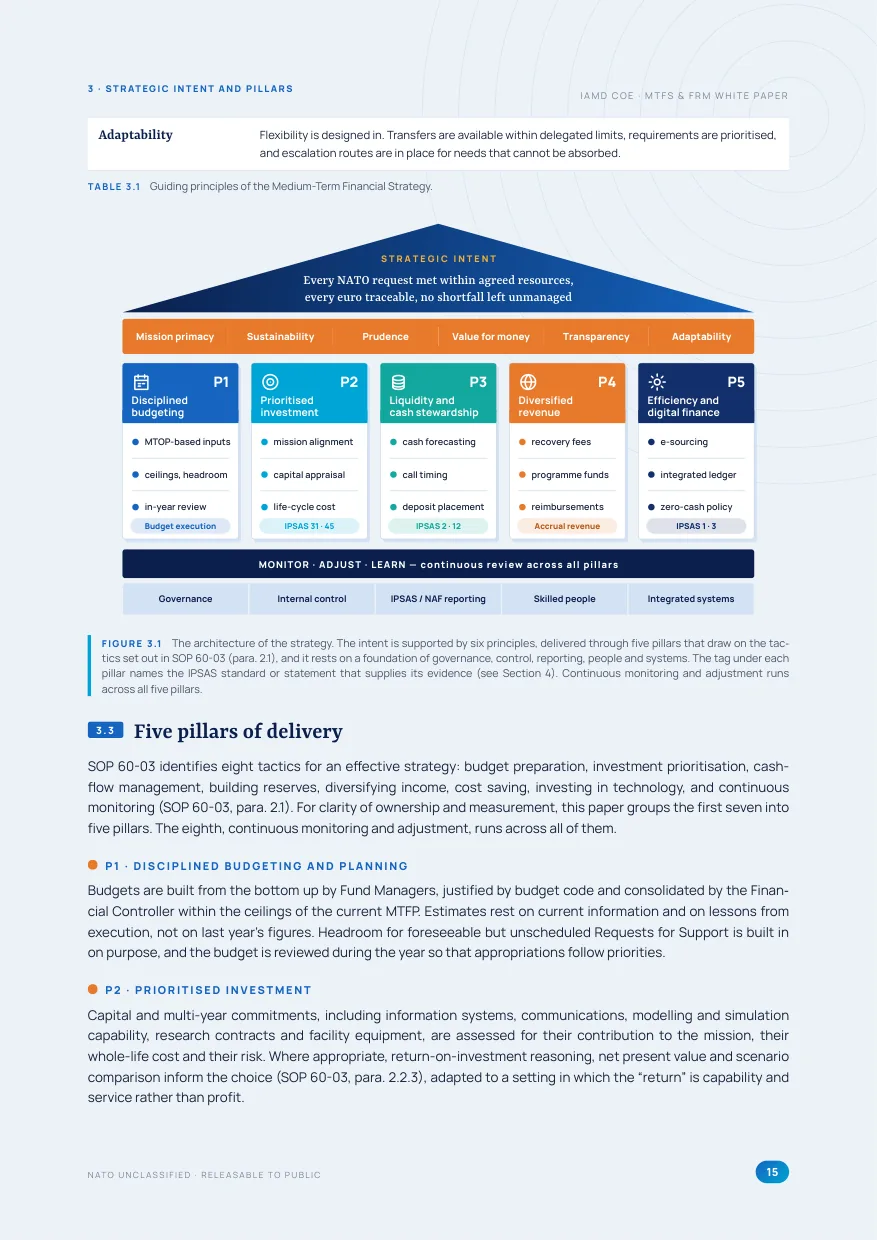
STRATEGICINTENT EveryNATOrequestmetwithinagreedresources, everyeurotraceable,noshortfallleftunmanaged Missionprimacy Sustainability Prudence Valueformoney Transparency Adaptability P1 Disciplined budgeting Budgetexecution MTOP-basedinputs ceilings,headroom in-yearreview P2 Prioritised investment IPSAS31·45 missionalignment capitalappraisal life-cyclecost P3 Liquidityand cashstewardship IPSAS2·12 cashforecasting calltiming depositplacement P4 Diversified revenue Accrualrevenue recoveryfees programmefunds reimbursements P5 Efficiencyand digitalfinance IPSAS1·3 e-sourcing integratedledger zero-cashpolicy MONITOR·ADJUST·LEARN, continuousreviewacrossallpillars Governance Internalcontrol IPSAS/NAFreporting Skilledpeople Integratedsystems Adaptability Flexibility is designed in. Transfers are available within delegated limits, requirements are prioritised, and escalation routes are in place for needs that cannot be absorbed.

TABLE 3.1 Guiding principles of the Medium-Term Financial Strategy.

FIGURE 3.1 The architecture of the strategy. The intent is supported by six principles, delivered through five pillars that draw on the tactics set out in SOP 60-03 (para. 2.1), and it rests on a foundation of governance, control, reporting, people and systems. The tag under each pillar names the IPSAS standard or statement that supplies its evidence (see Section 4). Continuous monitoring and adjustment runs across all five pillars.

3.3 Five pillars of delivery SOP 60-03 identifies eight tactics for an effective strategy: budget preparation, investment prioritisation, cashflow management, building reserves, diversifying income, cost saving, investing in technology, and continuous monitoring (SOP 60-03, para. 2.1). For clarity of ownership and measurement, this paper groups the first seven into five pillars. The eighth, continuous monitoring and adjustment, runs across all of them.

P1 · DISCIPLINED BUDGETING AND PLANNING Budgets are built from the bottom up by Fund Managers, justified by budget code and consolidated by the Financial Controller within the ceilings of the current MTFP. Estimates rest on current information and on lessons from execution, not on last year’s figures. Headroom for foreseeable but unscheduled Requests for Support is built in on purpose, and the budget is reviewed during the year so that appropriations follow priorities.

P2 · PRIORITISED INVESTMENT Capital and multi-year commitments, including information systems, communications, modelling and simulation capability, research contracts and facility equipment, are assessed for their contribution to the mission, their whole-life cost and their risk. Where appropriate, return-on-investment reasoning, net present value and scenario comparison inform the choice (SOP 60-03, para. 2.2.3), adapted to a setting in which the “return” is capability and service rather than profit.

3 · STRATEGIC INTENT AND PILLARS IAMD COE · MTFS & FRM WHITE PAPER NATO UNCLASSIFIED · RELEASABLE TO PUBLIC 15
White paper page: 04 Accounting for trust

Text of this page:

4.1 A special status, a higher bar Centres of Excellence sit at an unusual intersection. Each is a multinationally sponsored organisation, created and governed by its own memoranda of understanding and financed by its participating nations. Activation as a NATO Military Body adds a second identity. The IAMD COE was activated as a NATO Military Body following a decision by the North Atlantic Council and accreditation by the Military Committee, and it has since operated within the family of NATO military bodies, with the obligations of transparency, comparability and accountability that membership implies.

This dual character has a direct financial consequence. The Centre’s accounts must satisfy its participants, who approve them each year, and they must also be legible to the wider NATO community, which reads financial information through a common lens. NATO has adopted the International Public Sector Accounting Standards (IPSAS) as the basis of that lens. The NATO Accounting Framework adapts them to the Alliance’s circumstances, and the NATO Financial Regulations set the reporting requirements (NATO, 2015; NATO, 2016). The Centre prepares its annual financial statements in accordance with IPSAS and aligns them with those reporting stipulations, with due regard to the NATO Accounting Framework (Financial Statements 2025).

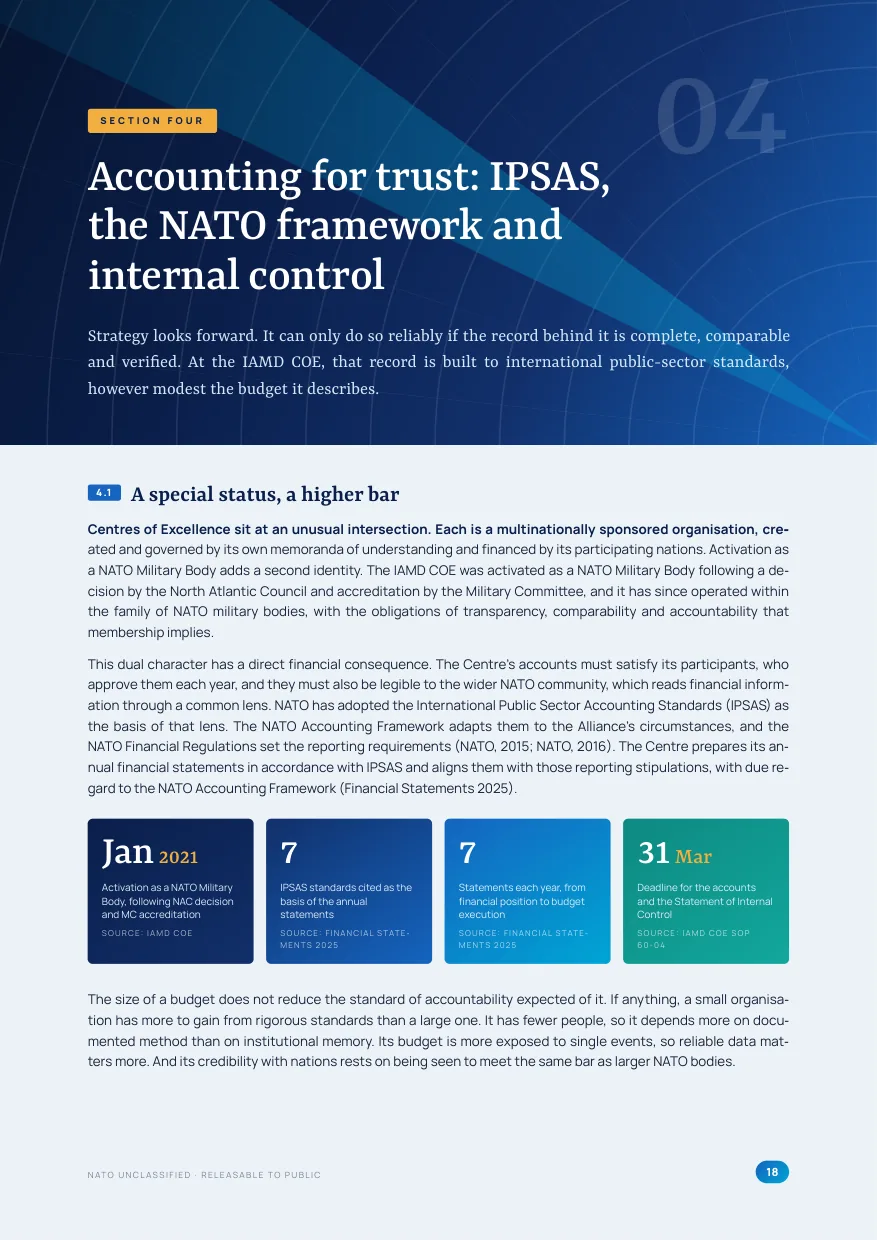
Jan 2021 Activation as a NATO Military Body, following NAC decision and MC accreditation SOURCE: IAMD COE 7 IPSAS standards cited as the basis of the annual statements SOURCE: FINANCIAL STATE- MENTS 2025 7 Statements each year, from financial position to budget execution SOURCE: FINANCIAL STATE- MENTS 2025 31 Mar Deadline for the accounts and the Statement of Internal Control SOURCE: IAMD COE SOP 60-04 The size of a budget does not reduce the standard of accountability expected of it. If anything, a small organisation has more to gain from rigorous standards than a large one. It has fewer people, so it depends more on documented method than on institutional memory. Its budget is more exposed to single events, so reliable data matters more. And its credibility with nations rests on being seen to meet the same bar as larger NATO bodies.

SECTION FOUR Accounting for trust: IPSAS, the NATO framework and internal control Strategy looks forward. It can only do so reliably if the record behind it is complete, comparable and verified. At the IAMD COE, that record is built to international public-sector standards, however modest the budget it describes.

04 NATO UNCLASSIFIED · RELEASABLE TO PUBLIC 18
White paper page: A closed accountability cycle

Text of this page:

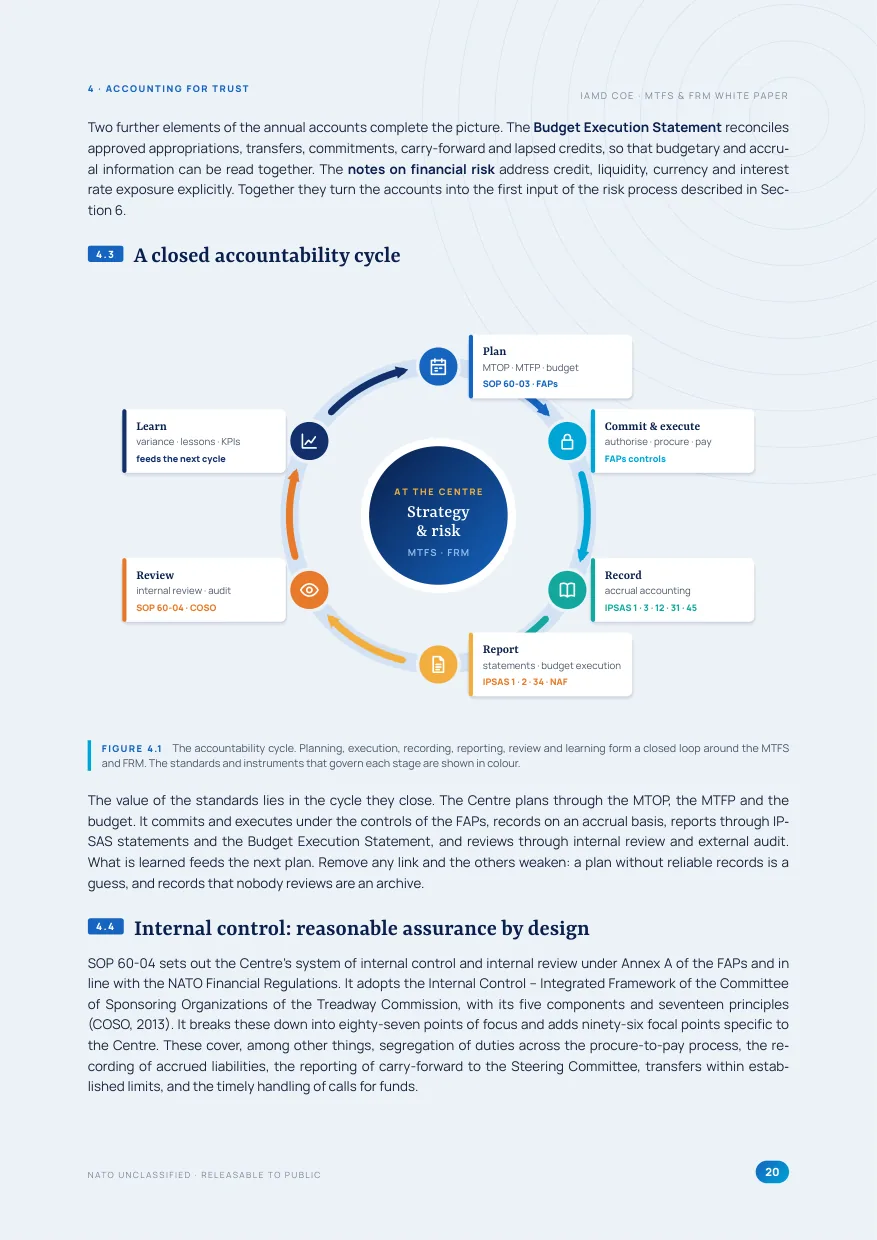
ATTHECENTRE Strategy &risk MTFS·FRM Plan MTOP·MTFP·budget SOP60-03·FAPs Commit&execute authorise·procure·pay FAPscontrols Record accrualaccounting IPSAS1·3·12·31·45 Report statements·budgetexecution IPSAS1·2·34·NAF Review internalreview·audit SOP60-04·COSO Learn variance·lessons·KPIs feedsthenextcycle Two further elements of the annual accounts complete the picture. The Budget Execution Statement reconciles approved appropriations, transfers, commitments, carry-forward and lapsed credits, so that budgetary and accrual information can be read together. The notes on financial risk address credit, liquidity, currency and interest rate exposure explicitly. Together they turn the accounts into the first input of the risk process described in Section 6.

4.3 A closed accountability cycle FIGURE 4.1 The accountability cycle. Planning, execution, recording, reporting, review and learning form a closed loop around the MTFS and FRM. The standards and instruments that govern each stage are shown in colour.

The value of the standards lies in the cycle they close. The Centre plans through the MTOP, the MTFP and the budget. It commits and executes under the controls of the FAPs, records on an accrual basis, reports through IP- SAS statements and the Budget Execution Statement, and reviews through internal review and external audit.

What is learned feeds the next plan. Remove any link and the others weaken: a plan without reliable records is a guess, and records that nobody reviews are an archive.

4.4 Internal control: reasonable assurance by design SOP 60-04 sets out the Centre’s system of internal control and internal review under Annex A of the FAPs and in line with the NATO Financial Regulations. It adopts the Internal Control - Integrated Framework of the Committee of Sponsoring Organizations of the Treadway Commission, with its five components and seventeen principles (COSO, 2013). It breaks these down into eighty-seven points of focus and adds ninety-six focal points specific to the Centre. These cover, among other things, segregation of duties across the procure-to-pay process, the recording of accrued liabilities, the reporting of carry-forward to the Steering Committee, transfers within established limits, and the timely handling of calls for funds.

4 · ACCOUNTING FOR TRUST IAMD COE · MTFS & FRM WHITE PAPER NATO UNCLASSIFIED · RELEASABLE TO PUBLIC 20
White paper page: 05 The analytical toolkit

Text of this page:

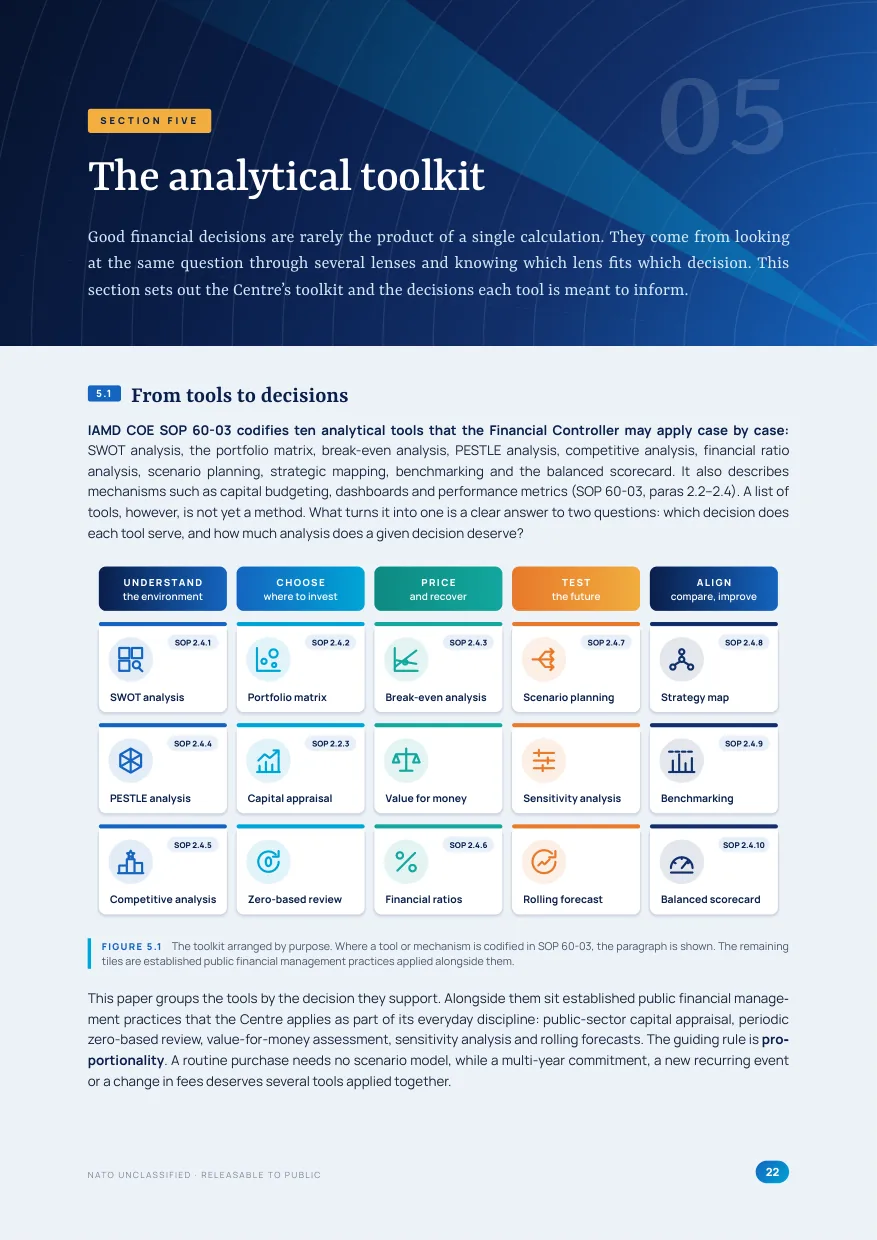
UNDERSTAND theenvironment SOP2.4.1 SWOTanalysis SOP2.4.4 PESTLEanalysis SOP2.4.5 Competitiveanalysis CHOOSE wheretoinvest SOP2.4.2 Portfoliomatrix SOP2.2.3 Capitalappraisal Zero-basedreview PRICE andrecover SOP2.4.3 Break-evenanalysis Valueformoney SOP2.4.6 Financialratios TEST thefuture SOP2.4.7 Scenarioplanning Sensitivityanalysis Rollingforecast ALIGN compare,improve SOP2.4.8 Strategymap SOP2.4.9 Benchmarking SOP2.4.10 Balancedscorecard 5.1 From tools to decisions IAMD COE SOP 60-03 codifies ten analytical tools that the Financial Controller may apply case by case:

SWOT analysis, the portfolio matrix, break-even analysis, PESTLE analysis, competitive analysis, financial ratio analysis, scenario planning, strategic mapping, benchmarking and the balanced scorecard. It also describes mechanisms such as capital budgeting, dashboards and performance metrics (SOP 60-03, paras 2.2-2.4). A list of tools, however, is not yet a method. What turns it into one is a clear answer to two questions: which decision does each tool serve, and how much analysis does a given decision deserve?

FIGURE 5.1 The toolkit arranged by purpose. Where a tool or mechanism is codified in SOP 60-03, the paragraph is shown. The remaining tiles are established public financial management practices applied alongside them.

This paper groups the tools by the decision they support. Alongside them sit established public financial management practices that the Centre applies as part of its everyday discipline: public-sector capital appraisal, periodic zero-based review, value-for-money assessment, sensitivity analysis and rolling forecasts. The guiding rule is proportionality. A routine purchase needs no scenario model, while a multi-year commitment, a new recurring event or a change in fees deserves several tools applied together.

SECTION FIVE The analytical toolkit Good financial decisions are rarely the product of a single calculation. They come from looking at the same question through several lenses and knowing which lens fits which decision. This section sets out the Centre’s toolkit and the decisions each tool is meant to inform.

05 NATO UNCLASSIFIED · RELEASABLE TO PUBLIC 22
White paper page: SWOT and PESTLE

Text of this page:

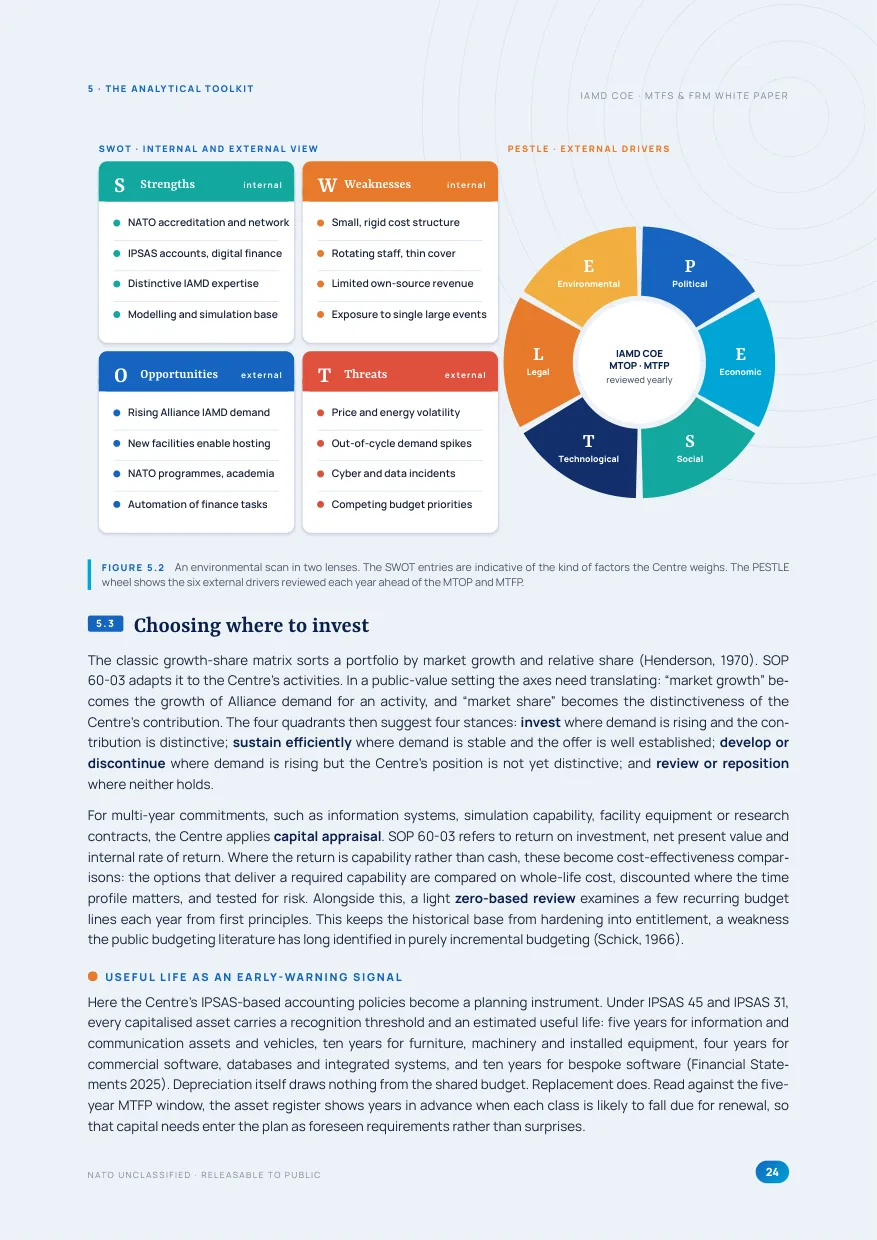
S Strengths internal NATOaccreditationandnetwork IPSASaccounts,digitalfinance DistinctiveIAMDexpertise Modellingandsimulationbase WWeaknesses internal Small,rigidcoststructure Rotatingstaff,thincover Limitedown-sourcerevenue Exposuretosinglelargeevents O Opportunities external RisingAllianceIAMDdemand Newfacilitiesenablehosting NATOprogrammes,academia Automationoffinancetasks T Threats external Priceandenergyvolatility Out-of-cycledemandspikes Cyberanddataincidents Competingbudgetpriorities SWOT·INTERNALANDEXTERNALVIEW PESTLE·EXTERNALDRIVERS P Political E Economic S Social T Technological L Legal E Environmental IAMDCOE MTOP·MTFP reviewedyearly FIGURE 5.2 An environmental scan in two lenses. The SWOT entries are indicative of the kind of factors the Centre weighs. The PESTLE wheel shows the six external drivers reviewed each year ahead of the MTOP and MTFP.

5.3 Choosing where to invest The classic growth-share matrix sorts a portfolio by market growth and relative share (Henderson, 1970). SOP 60-03 adapts it to the Centre’s activities. In a public-value setting the axes need translating: “market growth” becomes the growth of Alliance demand for an activity, and “market share” becomes the distinctiveness of the Centre’s contribution. The four quadrants then suggest four stances: invest where demand is rising and the contribution is distinctive; sustain efficiently where demand is stable and the offer is well established; develop or discontinue where demand is rising but the Centre’s position is not yet distinctive; and review or reposition where neither holds.

For multi-year commitments, such as information systems, simulation capability, facility equipment or research contracts, the Centre applies capital appraisal. SOP 60-03 refers to return on investment, net present value and internal rate of return. Where the return is capability rather than cash, these become cost-effectiveness comparisons: the options that deliver a required capability are compared on whole-life cost, discounted where the time profile matters, and tested for risk. Alongside this, a light zero-based review examines a few recurring budget lines each year from first principles. This keeps the historical base from hardening into entitlement, a weakness the public budgeting literature has long identified in purely incremental budgeting (Schick, 1966).

USEFUL LIFE AS AN EARLY-WARNING SIGNAL Here the Centre’s IPSAS-based accounting policies become a planning instrument. Under IPSAS 45 and IPSAS 31, every capitalised asset carries a recognition threshold and an estimated useful life: five years for information and communication assets and vehicles, ten years for furniture, machinery and installed equipment, four years for commercial software, databases and integrated systems, and ten years for bespoke software (Financial Statements 2025). Depreciation itself draws nothing from the shared budget. Replacement does. Read against the fiveyear MTFP window, the asset register shows years in advance when each class is likely to fall due for renewal, so that capital needs enter the plan as foreseen requirements rather than surprises.

5 · THE ANALYTICAL TOOLKIT IAMD COE · MTFS & FRM WHITE PAPER NATO UNCLASSIFIED · RELEASABLE TO PUBLIC 24

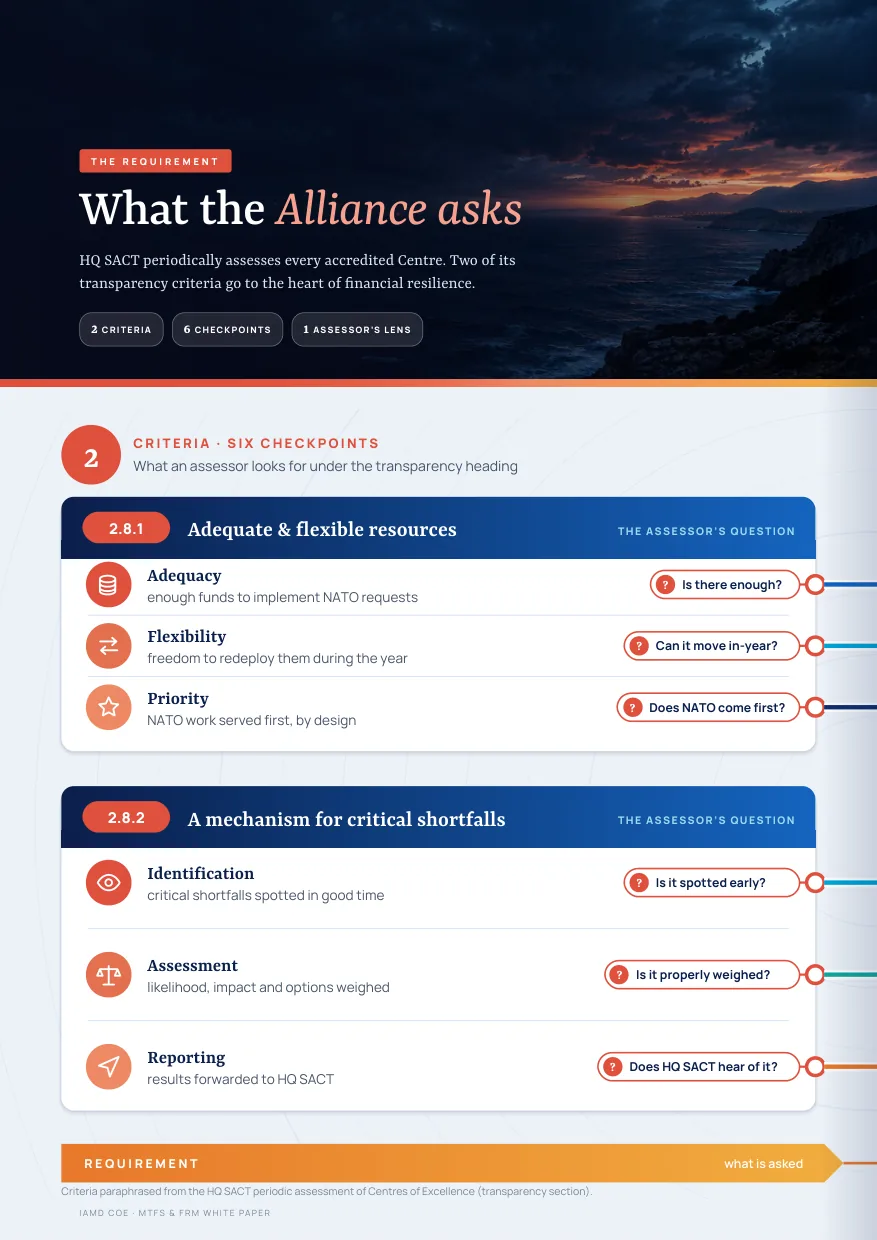
White paper page: What the Alliance asks

Text of this page:

THE REQUIREMENT What the Alliance asks HQ SACT periodically assesses every accredited Centre. Two of its transparency criteria go to the heart of financial resilience.

2CRITERIA 6CHECKPOINTS 1ASSESSOR’S LENS 2 CRITERIA·SIXCHECKPOINTS Whatanassessorlooksforunderthetransparencyheading 2.8.1 Adequate&flexibleresources THEASSESSOR’SQUESTION Adequacy enoughfundstoimplementNATOrequests ?

Isthereenough?

Flexibility freedomtoredeploythemduringtheyear ?

Canitmovein-year?

Priority NATOworkservedfirst,bydesign ?

DoesNATOcomefirst?

2.8.2 Amechanismforcriticalshortfalls THEASSESSOR’SQUESTION Identification criticalshortfallsspottedingoodtime ?

Isitspottedearly?

Assessment likelihood,impactandoptionsweighed ?

Isitproperlyweighed?

Reporting resultsforwardedtoHQSACT ?

DoesHQSACThearofit?

REQUIREMENT whatisasked CriteriaparaphrasedfromtheHQSACTperiodicassessmentofCentresofExcellence(transparencysection).

IAMD COE · MTFS & FRM WHITE PAPER

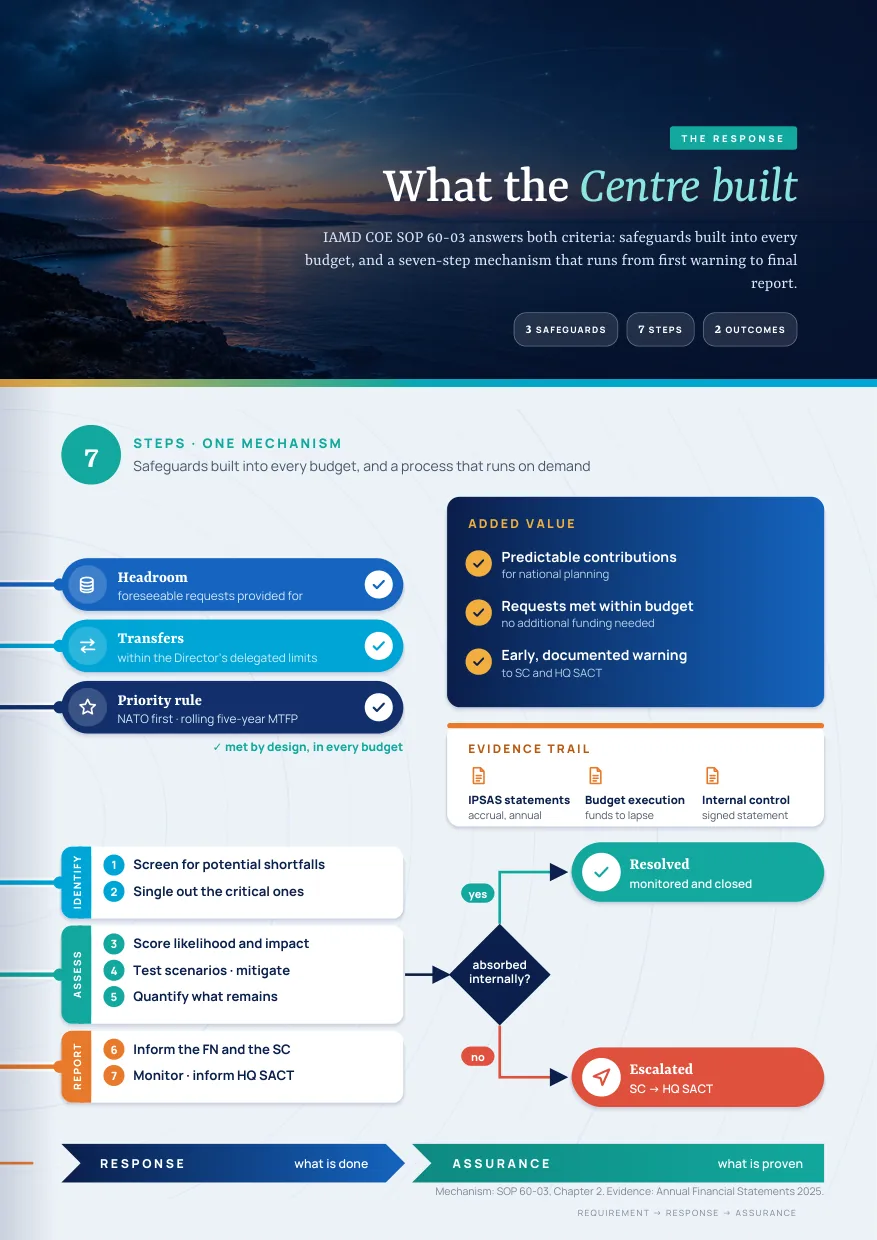
White paper page: What the Centre built

Text of this page:

THE RESPONSE What the Centre built IAMD COE SOP 60-03 answers both criteria: safeguards built into every budget, and a seven-step mechanism that runs from first warning to final report.

3SAFEGUARDS 7STEPS 2OUTCOMES 7 STEPS·ONEMECHANISM Safeguardsbuiltintoeverybudget,andaprocessthatrunsondemand Headroom foreseeablerequestsprovidedfor Transfers withintheDirector’sdelegatedlimits Priorityrule NATOfirst·rollingfive-yearMTFP ✓metbydesign,ineverybudget IDENTIFY 1 Screenforpotentialshortfalls 2 Singleoutthecriticalones ASSESS 3 Scorelikelihoodandimpact 4 Testscenarios·mitigate 5 Quantifywhatremains REPORT 6 InformtheFNandtheSC 7 Monitor·informHQSACT absorbed internally?

yes no Resolved monitoredandclosed Escalated SC→HQSACT ADDEDVALUE Predictablecontributions fornationalplanning Requestsmetwithinbudget noadditionalfundingneeded Early,documentedwarning toSCandHQSACT EVIDENCETRAIL IPSASstatements accrual,annual Budgetexecution fundstolapse Internalcontrol signedstatement RESPONSE whatisdone ASSURANCE whatisproven Mechanism:SOP60-03,Chapter2.Evidence:AnnualFinancialStatements2025.

REQUIREMENT → RESPONSE → ASSURANCE
White paper page: The risk heat map

Text of this page:

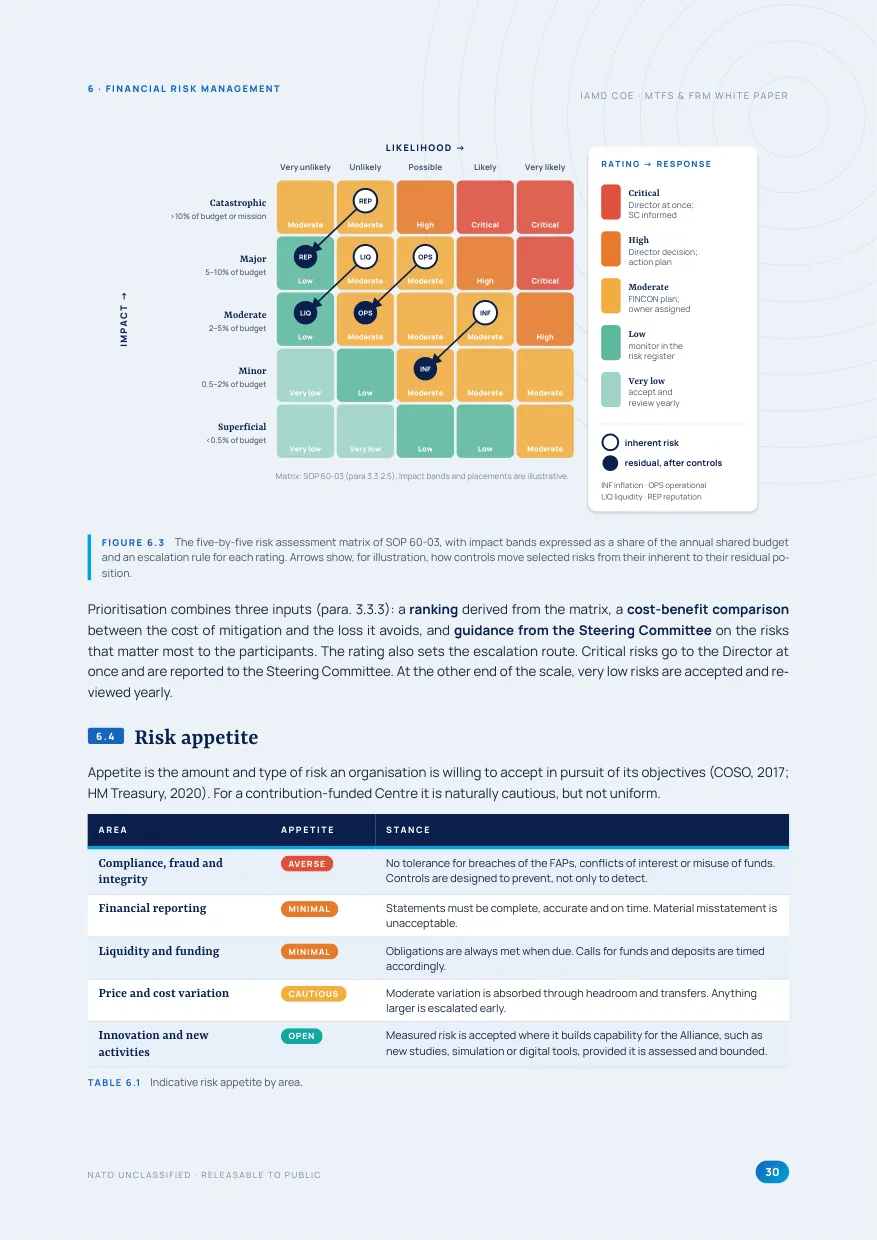
LIKELIHOOD→ Veryunlikely Unlikely Possible Likely Verylikely Catastrophic >10%ofbudgetormission Moderate Moderate High Critical Critical Major 5-10%ofbudget Low Moderate Moderate High Critical Moderate 2-5%ofbudget Low Moderate Moderate Moderate High Minor 0.5-2%ofbudget Verylow Low Moderate Moderate Moderate Superficial <0.5%ofbudget Verylow Verylow Low Low Moderate IMPACT→ INF INF OPS OPS LIQ LIQ REP REP RATING→RESPONSE Critical Directoratonce;

SCinformed High Directordecision;

actionplan Moderate FINCONplan;

ownerassigned Low monitorinthe riskregister Verylow acceptand reviewyearly inherentrisk residual,aftercontrols INFinflation·OPSoperational LIQliquidity·REPreputation Matrix:SOP60-03(para3.3.2.5).Impactbandsandplacementsareillustrative.

FIGURE 6.3 The five-by-five risk assessment matrix of SOP 60-03, with impact bands expressed as a share of the annual shared budget and an escalation rule for each rating. Arrows show, for illustration, how controls move selected risks from their inherent to their residual position.

Prioritisation combines three inputs (para. 3.3.3): a ranking derived from the matrix, a cost-benefit comparison between the cost of mitigation and the loss it avoids, and guidance from the Steering Committee on the risks that matter most to the participants. The rating also sets the escalation route. Critical risks go to the Director at once and are reported to the Steering Committee. At the other end of the scale, very low risks are accepted and reviewed yearly.

6.4 Risk appetite Appetite is the amount and type of risk an organisation is willing to accept in pursuit of its objectives (COSO, 2017;

HM Treasury, 2020). For a contribution-funded Centre it is naturally cautious, but not uniform.

AREA APPETITE STANCE Compliance, fraud and integrity AVERSE No tolerance for breaches of the FAPs, conflicts of interest or misuse of funds.

Controls are designed to prevent, not only to detect.

Financial reporting MINIMAL Statements must be complete, accurate and on time. Material misstatement is unacceptable.

Liquidity and funding MINIMAL Obligations are always met when due. Calls for funds and deposits are timed accordingly.

Price and cost variation CAUTIOUS Moderate variation is absorbed through headroom and transfers. Anything larger is escalated early.

Innovation and new activities OPEN Measured risk is accepted where it builds capability for the Alliance, such as new studies, simulation or digital tools, provided it is assessed and bounded.

6 · FINANCIAL RISK MANAGEMENT IAMD COE · MTFS & FRM WHITE PAPER NATO UNCLASSIFIED · RELEASABLE TO PUBLIC 30 TABLE 6.1 Indicative risk appetite by area.
White paper page: 08 Measuring performance

Text of this page:

Stakeholders Howdonationsand HQSACTseeus?

Financial Howwelldoweuse sharedfunds?

Internalprocesses Whichprocesses mustexcel?

Learning&growth Howdowesustain capability?

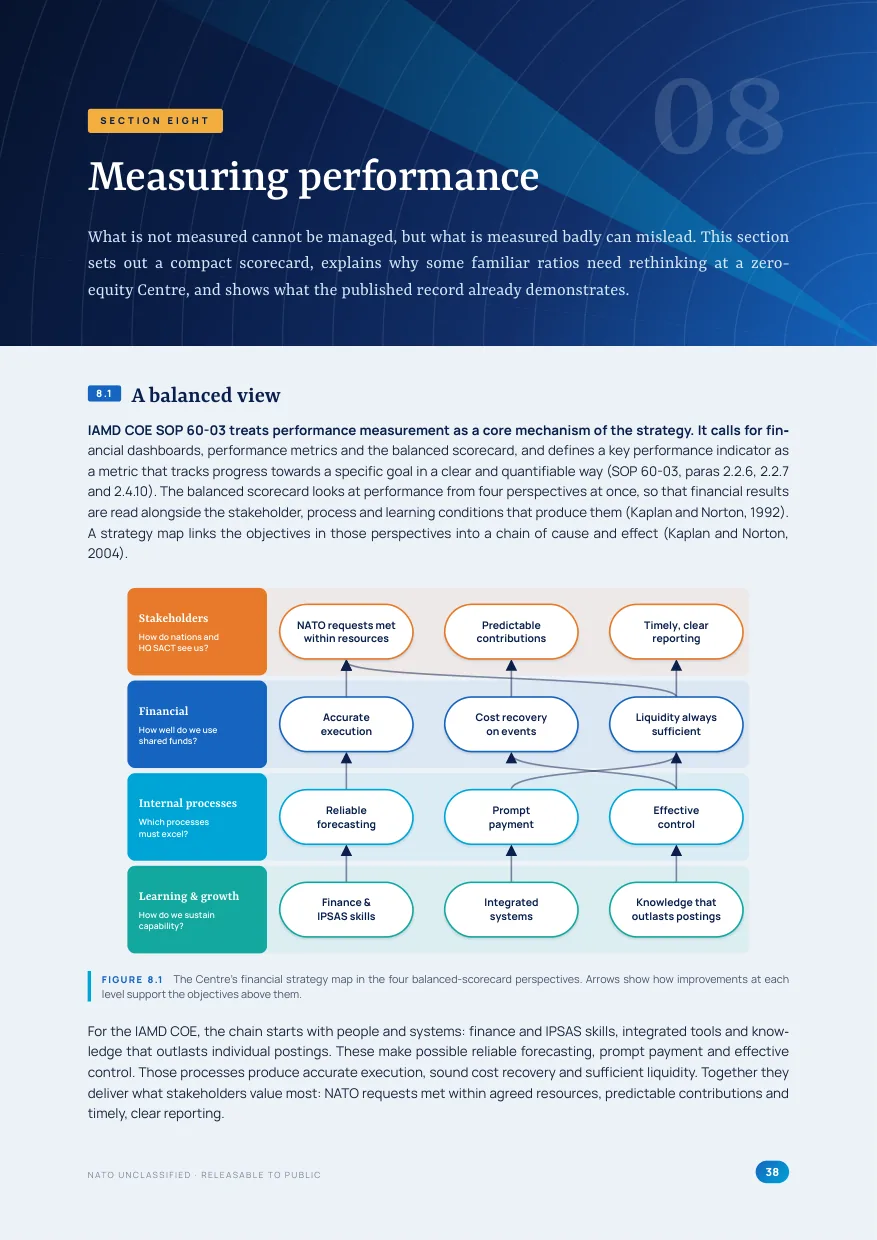
NATOrequestsmet withinresources Predictable contributions Timely,clear reporting Accurate execution Costrecovery onevents Liquidityalways sufficient Reliable forecasting Prompt payment Effective control Finance& IPSASskills Integrated systems Knowledgethat outlastspostings 8.1 A balanced view IAMD COE SOP 60-03 treats performance measurement as a core mechanism of the strategy. It calls for financial dashboards, performance metrics and the balanced scorecard, and defines a key performance indicator as a metric that tracks progress towards a specific goal in a clear and quantifiable way (SOP 60-03, paras 2.2.6, 2.2.7 and 2.4.10). The balanced scorecard looks at performance from four perspectives at once, so that financial results are read alongside the stakeholder, process and learning conditions that produce them (Kaplan and Norton, 1992).

A strategy map links the objectives in those perspectives into a chain of cause and effect (Kaplan and Norton, 2004).

FIGURE 8.1 The Centre’s financial strategy map in the four balanced-scorecard perspectives. Arrows show how improvements at each level support the objectives above them.

For the IAMD COE, the chain starts with people and systems: finance and IPSAS skills, integrated tools and knowledge that outlasts individual postings. These make possible reliable forecasting, prompt payment and effective control. Those processes produce accurate execution, sound cost recovery and sufficient liquidity. Together they deliver what stakeholders value most: NATO requests met within agreed resources, predictable contributions and timely, clear reporting.

SECTION EIGHT Measuring performance What is not measured cannot be managed, but what is measured badly can mislead. This section sets out a compact scorecard, explains why some familiar ratios need rethinking at a zeroequity Centre, and shows what the published record already demonstrates.

08 NATO UNCLASSIFIED · RELEASABLE TO PUBLIC 38

White paper page: In closing

Text of this page:

IN CLOSING Resilience is not a reserve we hold.

It is a discipline we practise.

Plan with foresight. Decide on evidence. Account to recognised standards.

Escalate early. And say plainly what was done with every euro entrusted to the Centre.

Plan Protect Prove Prevail

White paper page: The argument in one sentence

Text of this page:

WHITE PAPER · EDITION 1 · 2026 “ Every euro entrusted to a Centre of Excellence is a statement of confidence.

This White Paper explains how that confidence is honoured:

with foresight instead of reserves, evidence instead of assertion, and a warning that always arrives in time to be answered.

THE ARGUMENT OF THIS PAPER, IN ONE SENTENCE Plan FIVE-YEAR HORIZON Protect RISK-INFORMED DECISIONS Prove MEASURED VALUE Prevail NO UNMANAGED SHORTFALL RESILIENT BY DESIGN NATO UNCLASSIFIED · RELEASABLE TO PUBLIC

Cover

Medium-Term Financial Strategy and Financial Risk Management at the Integrated Air and Missile Defence Centre of Excellence. White paper, Edition 1. NATO UNCLASSIFIED, releasable to the public.

Ask about a white paper for your organisation

How we write them

Written to be used, not filed.

  • 01

    From practice

    Every study draws on procedures and systems that run today in a NATO financial environment, not on theory alone.

  • 02

    Evidence first

    Your own data, rules and records are read before a line is written, and every figure can be traced back to them.

  • 03

    Ready to decide on

    Written for boards, steering committees, auditors and funders: short where it can be, complete where it must be.

  • 04

    Yours to keep

    Editable documents and working files, handed over with the study, so your team can carry it forward.

Business Plus Benefit Research · October 2026

The Price of Readiness: Live and Synthetic Training, Attrition and the Financing of Allied Defence

Research paper page: Cover

Text of this page:

RESEARCH PAPER 01

OCTOBER 2026

BUSINESS PLUS BENEFIT RESEARCH The Price of Readiness

Live and Synthetic Training, Attrition and the Financing of Allied Defence

Evangelos Baltadoros Managing Director, Business Plus Benefit Advisory & Systems WWW.BUSINESSPLUSBENEFIT.COM

Research paper page: Foreword

Text of this page:

FOREWORD Why the price of readiness

Every defence budget records, with great precision, what is spent on training: fuel, flying hours, ammunition, simulators, ranges and exercises. Very few record what that spending buys. This paper is an attempt to close part of that gap.

The question has rarely mattered more. In June 2025 the Allies committed to raise defence and security spending to 5 per cent of gross domestic product by 2035, and the European Union has opened new instruments to help finance the effort.1, 2 At the same time, the wars in Ukraine and the Middle East have shown how quickly armed forces must now adapt, how fast modern warfare consumes munitions, interceptors, aircraft and trained people, and how much depends on the competence of crews and operators rather than on the platforms they use. A great deal of new money will be spent on readiness in the coming decade. It is worth asking, before it is spent, what readiness costs and how it is best produced.

The paper looks at that question from the perspective of public financial management. It asks what a unit of combat readiness costs when it is produced in the air, on the range, in a simulator or in a blend of all three; what the evidence says about the transfer of skills from synthetic to live environments, and where it fails; how the alliances and the major military powers divide their training between the two; what the current wars have taught about attrition, cost exchange and the speed of adaptation; and how the new spending should be financed, measured and accounted for. It closes with recommendations for NATO and the European Union and with an assessment for Greece.

The analysis draws only on open sources, and every factual statement is referenced. The evidence has been graded, and where it is thin, contested or classified the text says so. The cost model is deliberately simple, so that its assumptions can be seen and challenged. The views expressed are mine alone.

The paper is written for those who plan, fund, deliver and audit the readiness of allied forces. If it helps them to ask not only how much is being spent on training, but what that spending buys, it will have served its purpose.

Thessaloniki, October 2026

Business Plus Benefit Research · Paper 01 · October 2026 3

Research paper page: Abstract and key findings

Text of this page:

ABSTRACT AND KEY FINDINGS Abstract

Allied defence budgets are rising at a pace not seen for decades, yet governments measure the training that turns that money into combat readiness mainly by its inputs. This paper asks what a unit of readiness costs when it is produced live, synthetically or by a blend of the two; what the evidence says about the transfer of skills from simulators to real operations; how NATO, the European Union and fifteen states divide their training between the two; what the wars in Ukraine and the Middle East have taught about attrition, cost exchange and the speed of adaptation; and how the new spending should be financed and accounted for.

Drawing only on open sources, graded by strength, the paper finds that readiness is best understood as a depreciating stock and priced as a trained outcome rather than an hour; that synthetic training pays for itself wherever its transfer exceeds its relative cost, which at today's prices is almost everywhere it transfers at all; that the decisive limits are therefore evidence of transfer, the live floor, pilot time and the rules that decide what counts as training; that recent wars raise the cost of live training by consuming the same airframes, munitions and interceptors; and that neither NATO nor the European Union yet measures what the new money buys in readiness. It closes with eleven recommendations and an assessment for Greece.

KEY FINDINGS

The hour is the wrong unit. Planned flying across the US F-35 fleet fell by 21 per cent, which the US Government Accountability Office found is partly why most affordability targets are expected to be met, and UK Wildcat maintenance cost per hour more than doubled as hours fell.3, 4

01

Simulators are cheap; transfer is the limit. An F-15C simulator hour cost USD 230 in 2016 against USD 17,000 for the aircraft. A synthetic hour pays while its transfer exceeds its relative cost, so price no longer decides the mix.5

02

The evidence is uneven. The classic studies give a median transfer effectiveness ratio of about 0.45, strongest for individual procedural skills and weakest for collective, combat and drone training (Section 3).6

03

Blending saves at scale. Keeping one F-35A pilot at the 180-hour norm cited by the French Parliament by live flying costs about USD 3.35 million a year in marginal costs; delivering half synthetically saves about USD 1.5 million, and the synthetic share drives the result (Section 17).

04

Five ways to train. Simulation-intensive blends, live-anchored blends, combat-adaptive systems, exercise realism with AI ambition, and mass with proxy-war experience describe the states examined (Section 17).

05

Attrition competes with training. On one estimate the 39-day campaign against Iran in 2026 consumed about 1,200 PAC-3 interceptors, more than three times the number bought in FY2026; replacing munitions expended to 1 August 2026 was estimated at USD 21.7 billion.7, 8, 9

06

Adaptation runs in weeks. Russian launches of Shahed-type drones reached 8,161 in May 2026, and Ukraine codified 2,050 new equipment models in 2025 against 110 in 2022; training content must keep pace.10, 11

07

The money goes to equipment. In 2025, 28 of 29 Allies with estimates spent at least 20 per cent on equipment, while 'other' spending, which contains operations and maintenance, fell to 6.55 per cent in Greece. The simulation and training category received 1.6 per cent of the European Defence Fund's 2026 programme.12, 13

08

Accountability lags. The standards exist, but the US Department of Defense received disclaimers of opinion on its accounts for FY2023 to FY2025, and NATO's auditors examined EUR 283 million of EUR 9.6 billion of open investment expenditure in 2024.14, 15, 16, 17

09

Greece can buy more readiness. A high defence burden, the lowest share of 'other' spending (which contains operations and maintenance) among the Allies compared, a small SAFE allocation, accrual accounting from 2027 and the Kalamata and Andravida training centres define the agenda (Sections 15, 16 and 19).

10

4 Business Plus Benefit Research · Paper 01 · October 2026

Research paper page: Nine numbers on the price of readiness

Text of this page:

THE PAPER AT A GLANCE Nine numbers on the price of readiness

WORLD SPENDING 2,887USD bn World military expenditure in 2025, the eleventh consecutive year of growth.18

A LIVE HOUR 18,600USD Marginal cost of one F-35A flying hour at the FY2026 US reimbursable rate, before fixed costs.19

A SYNTHETIC HOUR 230USD Cost of an hour in the F-15C simulators at Tyndall Air Force Base in 2016, against USD 17,000 for the aircraft.20

TRANSFER 0.45 Median transfer effectiveness ratio in a classic review of military flight simulator studies: live hours saved per simulator hour.21

BLENDING 44% Saving in marginal costs from delivering half of a fighter pilot's annual training synthetically, in the central case of this paper's model (Section 17).

THE NORM 180hours Annual flying hours for a fighter pilot that the French Parliament cites as the NATO norm; French Air and Space Force fighter pilots were forecast to fly 147 in 2023.22, 23

ATTRITION 1,200 PAC-3 interceptors estimated to have been used in the 39-day campaign against Iran in 2026, more than three times the number bought in FY2026.24,

25

MASS 8,161 Shahed-type drones, including decoys, launched against Ukraine in May 2026 on Ukrainian Air Force data, the record month of the campaign.26

PRIORITIES 1.6% Share of the European Defence Fund's 2026 work programme in its simulation and training category: EUR 16 million of EUR 1 billion.27

Sources are numbered with the references for this page. Derived figures are the author's calculations from the sources cited in the sections indicated.

Business Plus Benefit Research · Paper 01 · October 2026 7

Research paper page: Part I. Foundations

Text of this page:

PART I Foundations What a unit of readiness is, how it is priced, and what the evidence says about the transfer of skill from the simulator to the aircraft, the vehicle and the ship.

Introduction and method 01

The economics of readiness 02

The evidence on transfer of training 03

Research paper page: 02 The economics of readiness

Text of this page:

02

PART I · FOUNDATIONS The economics of readiness Readiness is a stock that training builds, time erodes and war consumes. Its price is not the cost of a flying hour, which depends on what is counted, but the cost of a trained outcome, which few defence budgets measure.

IN BRIEF

18,600USD DoD reimbursable rate per F-35A flying hour, FY2026: fuel, spares, depot maintenance and consumables only51

21% Cut in planned annual F-35 fleet flying across the US services between the 2020 and 2023 estimates, which helps them meet cost-per-aircraft targets52

10.9USD m Cost of a basic qualified F-22 pilot, constant FY2018 dollars (RAND)53

This section builds the framework used in the rest of the paper. It sets out what a flying hour costs and what it leaves out, adds the opportunity costs that hourly rates ignore, proposes the cost of a trained outcome as the better measure and treats readiness as a capital stock. It then separates investment from running costs and defines live, virtual and constructive training as inputs to one production process. Annex B formalises the framework as a cost model. 2.1What a flying hour costs, and what it does not

The cost per flying hour (CPFH) is the default unit of account for training, but the label covers very different concepts (see box). The most transparent public series is

the set of reimbursable rates that the US Department of Defense (DoD) sets each year for billing between its components. For FY2026 the rate is USD 18,600 per hour for the F-35A, USD 14,818 for the Air Force F-16C, USD 29,992 for the F-15E and USD 55,051 for the F-22A (Figure 2.1).51 It covers fuel, depot-level reparables, depot maintenance and other consumables; crew pay is added only to rates charged outside the department, and a 4 per cent asset utilisation charge only to the rate for the public.54 Unit maintainers, sustaining engineering, software, modifications, indirect support and airframe depreciation are left out, which makes the rate the closest public proxy for the marginal cost of one more hour in the air.

The FY2026 US reimbursable rate for an F-35A hour, a proxy for marginal cost, is USD 18,600; it excludes fixed costs, and full costs per hour rise when hours fall. Live hours are rationed by spares, maintainers, ranges and instructors as well as money; planned F-35 fleet flying fell 21 per cent, which helps the services meet cost-per-aircraft targets.

A basic qualified fighter pilot cost the US Air Force USD 5.6 to 10.9 million (FY2018 dollars); Royal Air Force fast-jet training took 7.1 years in 2019, against an optimum of 3.9. Skills decay within months (half of procedural skill gains are lost in about 6.5 months on accuracy measures), so maintenance training is a running cost; new money flows mainly to equipment.

Business Plus Benefit Research · Paper 01 · October 2026 13

Research paper page: Which cost per hour?

Text of this page:

FIGURE 2.1 US DoD reimbursable rates per flying hour, FY2026, selected aircraft

Source: Author's chart from Office of the Under Secretary of Defense (Comptroller) (2025) data.51Note: 'Other DoD Component' rates, nominal USD per flying hour, effective 1 October 2025; F-16C is the Air Force rate. The rates cover fuel, depot-level reparables, depot maintenance and consumables; they exclude crew pay, unit maintenance personnel and other fixed costs, so they approximate the marginal cost of an additional hour, not its full cost.54

The rates are set in advance from budget data and can move sharply. Between FY2025 and FY2026 the F-35A rate rose by 9.2 per cent and the C-17A rate by 22.4 per cent in nominal terms (derived), while the Navy's rate for its small adversary fleet of F-16s fell from USD 24,703 to USD 5,993, a change hard to attribute to real costs.51, 55 Fuel adds volatility. Military Times reported that in May 2026 Senator Tim Kaine put the rise in aviation fuel costs since the start of the war with Iran at roughly 50 per cent, against the 10 per cent rise in flying hour costs assumed in the Air Force's pre-war FY2027 budget; its Chief of Staff observed that 'every year, the cost of flying hours changes from the time we budget for it to the time we execute it'.56 Full costs behave differently. RAND defines the cost per flying hour as a fleet's operating and support (O&S) costs divided by its flying hours, and warns that when hours are reduced 'cost per flight hour can increase', because much of the total is fixed.57 The Congressional Budget Office (CBO) agrees: 'as aircraft fly less, fixed costs are distributed over fewer hours, increasing costs per flying hour'.58 British data show the effect. Wildcat helicopter maintenance cost GBP 4,033 per hour in 2018/19, when the fleet flew 12,000 hours, and GBP 8,533 in 2022/23, on a basis of 8,695 hours: hours fell by about 28 per cent and the cost per hour more than doubled (derived),

although earlier years had also drawn on surplus Lynx spares.59

WHICH COST PER HOUR? Four measures share the name, and they are not interchangeable.

Reimbursable rate: the DoD's billing rate for fuel, spares, depot maintenance and consumables; a proxy for the marginal cost of an extra hour (F-35A, FY2026: USD 18,600).51, 54 Full O&S cost per hour: fleet costs, including personnel and fixed support, divided by hours flown; higher than the reimbursable rate, and rising when hours fall.57, 58 Programme average: a flying hour budget divided by the hours it buys; the Air Force's FY2027 request of USD 9.9 billion for about 1.1 million hours gives roughly USD 9,000 an hour across all fleets (derived).60 Cost per aircraft per year: annual sustainment per aircraft, the F-35 affordability measure, which can be met by flying less.52, 61

This paper values substitution at the reimbursable rate, which understates the saving (Annex B).

0 20k 40k 60k 80k 100k

B-2A USD96,949

B-52H USD66,003

F-22A USD55,051

F-15E USD29,992

C-17A USD23,895

F-35B USD23,155

KC-135R USD20,959

F-35A USD18,600

F-15EX USD17,321

F-16C USD14,818

A-10C USD11,453

T-38A/C USD6,730

USDperflyinghour,FY2026,nominal;excludescrewpayandfixedcosts

•

•

•

•

THE PRICE OF READINESS BUSINESS PLUS BENEFIT RESEARCH

14 Business Plus Benefit Research · Paper 01 · October 2026

Research paper page: Live: every hour in the air is spent capital

Text of this page:

LIVE Every hour in the air is spent capital. Fuel, spares and maintenance are only the visible part. Each live hour also consumes airframe life, airspace, range time and instructors that cannot be bought back.

USD 17,000 Cost of one F-15C flying hour, as cited by the United States Air Force, set against the 2016 simulator cost. Source: Mullen (c. 2017), 325th Fighter Wing; nominal, year not stated.

THE PRICE OF READINESS · LIVE

Research paper page: Synthetic: every hour in the model must prove its transfer

Text of this page:

SYNTHETIC Every hour in the model

must prove its transfer.

A synthetic hour is cheap only if it saves live time or builds skills that live training

cannot. Its value lies in the outcome, not in the price of the hour.

USD 230

Cost of one hour in the F-15C simulators at Tyndall Air Force Base in 2016,

about 1.4 per cent of the aircraft hour. Source: as left; ratio derived.

THE PRICE OF READINESS · SYNTHETIC

Research paper page: 03 The evidence on transfer of training

Text of this page:

03

PART I · FOUNDATIONS The evidence on transfer of training Half a century of research shows that simulators save live hours, but with sharply diminishing returns and very unevenly across tasks. The evidence is strong for individual procedural skills, weak for combat, collective and drone training, and policy has often run ahead of it.

IN BRIEF

0.45TER

Median transfer effectiveness ratio in 33 military flight simulator studies, range minus 0.4 to 1.999 0.12ratio

Median simulator to aircraft operating cost ratio in the same review, with most ratios between 5 and 20%99

0.17ITER Aircraft hours saved per trainer hour in hours 8 to 11 of the classic experiment, down from 1.72 in the first 3 hours100

Every economic argument for synthetic training rests on transfer: how much of what is learnt in a simulator carries over to the aircraft, vehicle or field, and how much live training it replaces. The research is half a century old, overwhelmingly American and mostly about aviation; most controlled studies date from 1972 to 1999, compare small groups and concern ab initio or helicopter training, so their lessons for combat aircraft, collective training and drones must be drawn with care.

3.1Measuring transfer

The standard experiment trains two groups to the same standard: a control group entirely in the aircraft, an experimental group first in a device and then in the aircraft. If the control group needs Y0 aircraft hours and a

group given x device hours needs Yx, research for the Federal Aviation Administration (FAA) and the US Army Research Institute for the Behavioral and Social Sciences defines three measures.101, 102 Per cent transfer is the saving as a share of the control group's time. The TER is the aircraft time saved per device hour; computed after successive amounts of device time, it is the cumulative transfer effectiveness ratio (CTER). The ITER divides the saving from the latest block of k device hours by k.

Per cent transfer = 100 × (Y0 - Yx) / Y0 (3.1)

TER = CTER(x) = (Y0 - Yx) / x (3.2)

Simulators save live training, but modestly and unevenly: across 33 military flight simulator studies a simulator hour saved a median of 0.45 aircraft hours, with results ranging from negative to almost two. Returns diminish fast: in the classic experiment the saving per trainer hour fell from 1.72 to 0.17 within 11 hours. At today's low cost ratios, transfer rather than price sets the limit.

How a device is used matters at least as much as its fidelity: programmes with designed syllabi showed over twice the cumulative transfer, while platform motion added almost nothing for expert pilots. The evidence is strongest for individual procedural and weapons delivery skills and weakest for collective, combat and drone training, where targets and thresholds have run ahead of measured transfer.

22 Business Plus Benefit Research · Paper 01 · October 2026

Research paper page: Diminishing returns

Text of this page:

ITER(x) = (Yx-k - Yx) / k (3.3)

A TER of 1 means that a device hour replaces an aircraft hour; a lower value can still pay if the device hour is cheaper by a larger factor, and a negative value means that device training lengthened later aircraft training (negative transfer). In the classic Povenmire and Roscoe experiment, students trained only in the aircraft needed 45.42 hours on average to pass the final flight check, and those given 3 hours in a Link GAT-1 ground trainer needed 40.26: a saving of 5.16 hours, or 11 per cent, and a CTER of 1.72. Students given 7 trainer hours saved 6.80 hours (CTER 0.97), but their extra 4 hours saved only 1.64, an ITER of 0.41. With 11 hours the saving was 7.49 hours (CTER 0.68), and the last 4 hours saved 0.69, an ITER of 0.17.100 The cumulative ratio still looked respectable when the incremental ratio had fallen to a

quarter of it, which is why decisions on how many hours to buy must use the incremental measure. 3.2Diminishing returns and the Roscoe rule

Roscoe introduced the incremental transfer effectiveness function in 1971: each successive block of ground training yields a smaller saving in the aircraft, a relationship he proposed for all instruction.103 The Povenmire and Roscoe experiment confirmed the predicted 'negatively decelerated' shape, with orderly and statistically reliable differences between groups (p = 0.0014), although the groups that passed numbered only 9 to 14 students each (Figure 3.1).100 An FAA study three decades later described its results as diminishing returns: 10, 15 and 20 hours in a flight training device saved 2.78, 4.45 and 5.59 aircraft hours, implying incremental ratios of 0.28, 0.33 and 0.23 for successive blocks (author's calculation).104

FIGURE 3.1 Diminishing returns: aircraft hours saved per hour in a ground trainer

Source: author's chart from Povenmire and Roscoe (1972), Table 2, hours to pass the final flight check;100 cost ratios from Povenmire and Roscoe (1972) and Orlansky and String (1977).99Note: ITER is the average saving per trainer hour within each block (hours 1 to 3, 4 to 7 and 8 to 11), drawn as a step; CTER is the cumulative ratio after 3, 7 and 11 hours. A block of trainer hours pays while its step lies above the cost ratio line. Civil ab initio course; groups of 9 to 14 students; nominal costs of about 1972 and FY1975 to 1976.

The economic rule follows. Training in the device should continue while the next hour saves more aircraft time than the ratio r of the device's hourly cost cS to the aircraft's cL, in the notation of Annex B:

Continue while ITER(x) > r = cS / cL (3.4)

With the GAT-1 at USD 16 an hour and a Piper Cherokee at USD 22 (nominal, about 1972), Povenmire and Roscoe concluded that 'ground training could be continued profitably until the next hour would save less than 16/22 or

0.73 hour in flight', a point they placed between the fourth and fifth hours; measured block by block, only the first 3 hours clear that threshold (Annex B, Table B.3).100 An Institute for Defense Analyses (IDA) re-analysis, based on hours to the proficiency criterion rather than to the final flight check, found that about 3 trainer hours gave the cheapest mix, while the 11-hour group, despite the highest per cent transfer, cost USD 996.60 in total against USD 978.78 for students trained only in the aircraft.105 Maximising transfer and minimising cost are different objectives.

0.0

0.5

1.0

1.5

2.0

0h 3h 7h 11h

1972costratio,0.73

IDAmediancostratio,0.12

ITER:savingpertrainerhourwithineachblock CTER:cumulativesavingpertrainerhour

0.68

0.17

1.72

0.41

0.97

Aircrafthourssavedperhourinthegroundtrainer,bycumulativehoursinthetrainer

BUSINESS PLUS BENEFIT RESEARCH TRANSFER OF TRAINING

Business Plus Benefit Research · Paper 01 · October 2026 23

Research paper page: Part II. Powers and alliances

Text of this page:

PART II Powers and alliances How the alliances and the major military powers divide their training between the live and the synthetic, at what scale and under which constraints.

NATO and the European Union: standards,

structures and instruments 04

The United States: abundant money, scarce

capacity 05

Russia: buying soldiers, learning in combat 06

China: training for a war it has not fought 07

India: a short war and a long pipeline 08

Israel: readiness under continuous war 09

Ukraine: training at the speed of war 10

North Korea: readiness by mass and by

proxy war 11

Allies and partners in brief 12

Research paper page: 04 NATO and the European Union

Text of this page:

04

PART II · POWERS AND ALLIANCES NATO and the European Union: standards, structures and instruments NATO sets standards and runs exercises, but nations pay for most Alliance training, and the European Union's new defence money flows mainly to industry. Neither body publishes what training costs or buys in readiness, and NATO's common synthetic environment is still being procured.

IN BRIEF

5.3EUR bn NATO common funding ceiling, 2026, of which EUR 2.42 billion is the Military Budget153

16EUR m EDF 2026 'Simulation and Training' category, 1.6% of a EUR 1 billion work programme (derived)154

23.4% Operations and maintenance share of EU Member States' defence spending in 2025, including exercises and training155

This section examines the two multilateral frameworks within which most European Allies train. The NATO sets standards, plans exercises and pools some training; the EU has, mostly since 2022, built financial instruments for defence. Three economic questions follow: who pays for Alliance training, what the institutions spend on simulation and its standards, and whether the new EU money reaches the activities that produce readiness. On the evidence available, the institutions shape training far more through standards and coordination than through money. Their own budgets are small, their exercise costs are unpublished, and their readiness documents are framed in terms of equipment (Sections 15 and 16).

4.1Who pays for Alliance training

NATO's own budgets are small. On 16 December 2025 the North Atlantic Council agreed a 2026 Civil Budget of EUR 528.2 million and a Military Budget of EUR 2.42 billion, the latter funding, among other things, 'NATO-led training and exercises'.156 With a NATO Security Investment Programme (NSIP) ceiling of EUR 2.2 billion, NATO puts its direct common funding at 'around EUR 4.6 billion for 2025, and up to EUR 5.3 billion for 2026', and states that the Military Budget covers training and exercises only 'to some extent'.153 Against the USD 1,588 billion that NATO estimated its members would spend on

NATO's common funds, up to EUR 5.3 billion in 2026, are of the order of 0.3 per cent of Allied defence spending; nations pay for most Alliance training and exercises. NATO's largest exercise in decades involved some 90,000 troops, while simulation-based command post exercises involved 5,000 to 7,000 staff each. None has a published cost.

A 2025 target for Modelling and Simulation as a Service, set by NATO experts in 2018, was apparently missed; the common synthetic environment was still in competitive procurement in September 2026. The EU earmarks EUR 16 million of its 2026 defence fund work programme for simulation and training, against about EUR 98 billion of national operations and maintenance spending in 2025.

30 Business Plus Benefit Research · Paper 01 · October 2026

Research paper page: 06 Russia: buying soldiers, learning in combat

Text of this page:

06

PART II · POWERS AND ALLIANCES Russia: buying soldiers, learning in combat Russia has regenerated its army in wartime by paying for recruits and learning on the battlefield, with little visible use of simulation. The model restores numbers quickly, but it turns training deficits into casualties and keeps most of its cost out of sight.

IN BRIEF

7.5% of GDP Military expenditure, 2025, about USD 190 billion (SIPRI estimate)275

79% Classified share of the National defence chapter, 2025; 76% in the 2026 budget law (derived from SIPRI data)276

20,000USD Up-front bonuses per recruit, federal and regional, first half of 2025 (derived from estimates by J. Kluge)277

This section argues that Russia has regenerated military mass during the war mainly by spending money and accepting losses, not by investing in long training. It has paid cash for recruits, given many of them only basic preparation, built a separate and better paid drone arm, and let the battlefield do much of the teaching. The evidence is thin by design: most figures are official claims or analyst estimates, labelled as such, and where nothing reliable exists the text says so.

6.1Budget scale and opacity

The SIPRI estimates that Russia's military expenditure rose by 5.9 per cent in real terms in 2025 to about USD 190 billion, equal to 7.5 per cent of GDP, making Russia the world's third largest military spender.275 In roubles, SIPRI's measure more than tripled in nominal terms,

from RUB 4.9 trillion in 2021 (3.6 per cent of GDP) to almost RUB 16 trillion in 2025, after real growth of 38 per cent in 2024 (Figure 6.1).276 The International Institute for Strategic Studies (IISS), using its own definition, puts 2025 spending at USD 186 billion, or 7.3 per cent of GDP, as reported by Defense News.278

Russia spent an estimated 7.5 per cent of GDP on the military in 2025, yet about three quarters of its National defence budget chapter is classified, so training costs cannot be isolated. Russia buys manpower: up-front bonuses of about USD 20,000 per recruit and contract pay over six times its pre-war level, while losses and instructor shortages left many recruits with only basic training.

A professional drone arm now stands beside the mass infantry: a new Unmanned Systems Forces branch, a pipeline of up to three months and an elite centre that trains, tests and fights. Russia learns in combat, not simulators: open sources show little simulation, adaptation cycles of weeks, and about 8,000 troops in Belarus for Zapad 2025, against 100,000 claimed.

42 Business Plus Benefit Research · Paper 01 · October 2026

Research paper page: Russia: the wartime training model

Text of this page:

FIGURE 6.1 Russia: military expenditure as a share of GDP, 2021 to 2028

Source: Author's chart from Cooper (2026), SIPRI, Tables 7 and 8.276Note: SIPRI definition of total military expenditure. Values for 2023 and 2024 are SIPRI author estimates; 2025 is the final 2025 budget; 2026 is the budget law; 2027 and 2028 are plans in that law. The draft budget for 2027 to 2029, submitted to the State Duma in late September 2026, raises the 2027 National defence chapter by about 27 per cent, so the 2027 bar is likely to be superseded.279, 280

The 2026 budget law set the narrower National defence chapter at RUB 12.1 trillion (5.2 per cent of GDP), down from RUB 13.6 trillion in the amended 2025 budget, and SIPRI's total for 2026 falls to RUB 14.9 trillion (6.3 per cent of GDP).276 The decline may be short-lived. The draft budget for 2027 to 2029, first reported by Reuters from budget documents and submitted to the State Duma in late September 2026, plans a record RUB 17.1 trillion for the chapter in 2027, about 27 per cent above the previous plan for that year; the Duma was due to begin examining it on 22 October 2026, so the figure remains subject to amendment.279, 280, 281, 282 Wartime plans have also proved to be floors: on a Jamestown Foundation compilation of Finance Ministry data, the chapter reached RUB 5.5 trillion in 2022 against RUB 3.5 trillion planned.283

METHOD NOTE Four Russian numbers circulate, and they are not interchangeable. The National defence chapter of the federal budget excludes military pensions, paramilitary forces and regional spending; SIPRI's military expenditure adds them;276 the IISS applies its own definition;278 and the defence minister's figure for spending directly related to the war, about RUB 11.1 trillion (5.1 per cent of GDP) in 2025, was disclosed in December 2025 without a published definition.284 This paper uses SIPRI's series for trends and does not mix the four in one chart.

Opacity is itself a finding. On SIPRI's figures, the classified residual of the National defence chapter, the total less the lines that are published, was about 79 per cent in 2025 and 76 per cent in the 2026 budget law (derived).276 Russia has 'strictly limited the information it provides on budget spending',285 and SIPRI judges that publication of data on the scale of funding for the next State Armament Programme, for 2027 to 2036, is 'extremely unlikely until after the war is over'.276 No series allows training, simulation or exercise costs to be isolated, and no verified outturn series for the chapter since 2021 was found for this paper. The rest of this section therefore relies on proxies: pay and bonuses, recruitment volumes, declared exercise sizes and the structure of new formations.

6.2The wartime training model

Russia has filled its ranks by paying for volunteers. The German Institute for International and Security Affairs (SWP) found that contract soldiers earned at least EUR 2,110 a month in 2024, against about EUR 330 before the full-scale invasion and a national average income of about EUR 800 (Figure 6.2).286 Bonuses come on top. Jānis Kluge of SWP estimates that Russia spent at least USD 4 billion on sign-on bonuses in the first half of 2025, combining a federal payment of RUB 400,000 with regional payments averaging roughly RUB 1.15 million: about USD 20,000 per recruit before any salary (derived from his totals).277 SIPRI notes that regional budgets allocated about RUB 0.5 trillion in 2025 to each of two war-related purposes, including such payments, outside the National defence chapter.276 FIGURE 6.2 Monthly pay of a Russian contract soldier against average incomes

Source: Author's chart from Klein (2024), SWP Comment 24.286Note: euro equivalents of rouble amounts as published by SWP in June 2024, nominal. The soldier bars show monthly contract pay before February 2022 and the minimum in 2024, excluding one-off bonuses and death and disability payments; the other bars show average monthly income nationally and in poorer regions.

Russian officials report about 450,000 contract signings in 2024 and 422,704 in 2025 (plus some 32,000 in volunteer formations); the figures are unaudited.287

Outturnorestimate Budgetplan

0%

2%

4%

6%

8%

3.6%

2021

4.8%

2022

5.3%

2023

7.2%

2024

7.5%

2025

6.3%

2026

6.2%

2027

5.5%

2028

PercentofGDP,SIPRIdefinition

0 500 1,0001,500 2,000 2,500

Soldier,pre-2022 EUR330

Poorerregions EUR400

Nationalaverage EUR800

Soldier,2024(min.) EUR2,110

EURpermonth(SWPconversions)

BUSINESS PLUS BENEFIT RESEARCH RUSSIA

Business Plus Benefit Research · Paper 01 · October 2026 43

Research paper page: 07 China: training for a war it has not fought

Text of this page:

07

PART II · POWERS AND ALLIANCES China: training for a war it has not fought China buys readiness with steady money, exercise realism and synthetic opponents in place of combat experience. Its official budget has more than doubled since 2015, yet the purges suggest that readiness can suffer while spending rises.

IN BRIEF

1.91CNY tn Official central defence budget, 2026, up 7.0 per cent in nominal terms311

5,709 PLA aircraft sorties around Taiwan in 2025, a record, as reported by Defense News312

101 Senior PLA leaders purged since 2022, CSIS count reported in March 2026312

China is the clearest case of a major military that must produce readiness without combat to test it. The US DoD notes that the PLA has not experienced combat in decades and that PLA 'blue forces' emulate the US military in wargames and training.313 The PLA relies instead on three substitutes: a steadily rising budget, live exercises at operational scale around Taiwan, and synthetic training augmented by AI. This section examines each, treating readiness as a capital stock (Section 2), and adds a fourth factor that no budget records: the purges of the senior command.

7.1Budget scale: steady money, uncertain totals

China's central government presented a 2026 defence budget of about CNY 1.91 trillion to the National People's Congress (NPC) on 5 March 2026, a nominal increase of 7.0 per cent and the eleventh consecutive year of single-digit growth.311, 314 Including local budgets, the national budget allocates CNY 1.94 trillion to defence, 6.9 per cent above the 2025 outturn.315 The official budget stood at CNY 886.9 billion in 2015, the last year of double-digit growth (10.1 per cent), so it has more than doubled in nominal terms in eleven years.316 Announced growth has since stayed within a band of 6.6 to 8.1 per cent (Figure 7.1).311, 317, 318

China's official defence budget reached CNY 1.91 trillion in 2026, more than double 2015 in nominal terms; external estimates put actual spending at roughly 1.3 to 2.0 times the official figure. Without recent combat, the People's Liberation Army (PLA) uses pressure operations around Taiwan as live training at operational scale: 153 aircraft in one day in October 2024 and a record 5,709 sorties in 2025.

Synthetic means partly fill the gap: AI opponents in air combat simulators, AI-augmented wargaming and an AI decision aid in a 2025 naval drill, although evidence of scale and effect is anecdotal. The purges are a readiness cost invisible in the budget: by one count 101 senior leaders were purged since 2022 while spending kept rising, so money and readiness have decoupled.

46 Business Plus Benefit Research · Paper 01 · October 2026

Research paper page: Exercises around Taiwan

Text of this page:

FIGURE 7.3 PLA aircraft counted around Taiwan in one day, major exercises, 2022 to 2024

Source: Author's chart from Taiwan MND counts compiled by CSIS (Lin and Hart, 2024a; 2024b).330, 331Note: highest daily count in each exercise: drills of August 2022, Joint Sword (April 2023), Joint Sword 2024A (May 2024) and Joint Sword 2024B (October 2024), which lasted about 13 hours. Counts for 2025 exercises are not shown because they could not be confirmed against MND releases.

Activity rose again in 2025. In Strait Thunder 2025A, on 1 and 2 April, the PLA Eastern Theater Command practised naval blockade manoeuvres and simulated strikes on Taiwan's energy and port facilities.329 Over the year, PLA aircraft flew a record 5,709 sorties in the Taiwan Strait and Taiwan's ADIZ, an average of about 16 a day, as reported by Defense News.312 These operations are live training of an unusual kind. They rehearse the joint command, logistics and coast guard coordination that a blockade would require against a real opponent's sensors and responses, which no simulator fully reproduces (Section 3). They also consume the inputs that make live training expensive, from airframe hours and fuel to maintenance and crew time, paid from operating budgets that China does not publish. Part of that cost is recovered because the same sorties serve coercion and surveillance: one expenditure buys training, political signalling and intelligence. The PLA has also gained combat data at second hand. The USCC described the air battle between India and Pakistan in May 2025 as 'the first known instance' of PLA-linked fighters and air-to-air missiles being tested in actual combat, a 'real-world field experiment' for Chinese systems (Section 8).329 For a military that cannot validate its training in war, such evidence has unusual value. 7.4Simulation, wargaming and artificial intelligence

Where live training cannot reach, the PLA turns to simulation. The DoD judges that the PLA 'is almost certainly

working to further augment its wargaming capabilities with artificial intelligence', and that it is building a simulation-based combat evaluation system under its Multi- Domain Precision Warfare concept, stressing 'quantitative analysis and simulation verification'.313 Research for the Center for a New American Security (CNAS) had earlier described PLA thinking about 'intelligentized' warfare, 'in which AI will be critical to military power'.332 The economic aim is to test concepts against a modelled opponent more often and more cheaply than live exercises allow. The PLA Air Force presents AI as a training multiplier. In 2021 state media reported that it was using AI as simulated adversaries in air combat training, and that an AI had repeatedly 'shot down' Fang Guoyu, a former brigade air combat champion, in simulator engagements; his brigade commander praised its 'errorless tactical decisions'.333 The account is an official claim with no independent data on frequency or training effect. Its logic, however, addresses a known limit of synthetic training, the lack of a credible and adaptive adversary (Section 3): an opponent that learns from every engagement supplies demanding adversary air at the cost of computing rather than of a second aircraft. Similar claims extend to command and to uncrewed systems. According to the South China Morning Post, researchers at the PLA National Defense University reported in 2024 an AI system that plays the commander-in-chief role in large computer wargames, kept 'strictly confined to a laboratory'.334 The USCC recorded that in May 2025 the PLA Navy held a simulated drill marking its first operational deployment of an AI- assisted decision-making system.329 CNAS judged in 2024 that 'Chinese forces are better positioned to leverage drones than the United States or Taiwan', and the September 2025 parade displayed airborne and sea- based unmanned warfare formations.335, 336 The evidence is uneven: most of it comes from state media or single reports, and none of it quantifies simulator inventories, synthetic hours or transfer of training. What it shows is intent. The US intelligence community describes China as the most capable competitor in AI, aiming to displace the United States as the global leader by 2030.337 For a force that cannot learn from combat, synthetic environments are the main place to rehearse a high-end war against a modelled US opponent and, as the 2021 report's headline put it, a place that 'trains both pilots and AIs'.333 Section 18 considers the implications for the Alliance's own synthetic environments.

0

50

100

150

200

68

Aug2022

91

Apr2023

62

May2024

153

Oct2024

PLAaircraftcountedinoneday

BUSINESS PLUS BENEFIT RESEARCH CHINA

Business Plus Benefit Research · Paper 01 · October 2026 49

Research paper page: 10 Ukraine: training at the speed of war

Text of this page:

10

PART II · POWERS AND ALLIANCES Ukraine: training at the speed of war Ukraine has turned adaptation into a system: new equipment is codified weekly, drones are made by the million and bought on combat data. Training has had to follow, moving from courses abroad to instructors, schools and cheap simulators at home.

IN BRIEF

40% of GDP Military expenditure, 2025, USD 84.1 billion and 63% of government spending (SIPRI estimate)391

2,050models New equipment models codified for service, 2025, against 110 in 2022 (Ministry of Defence data)392

11,000instructors Ukrainian instructors trained by Interflex who now lead recruit training inside Ukraine, May 2026393

Ukraine is the clearest case in this paper of training at operational tempo. Its weapons, threats and tactics have changed within months, and it has had to produce trained people faster than any peacetime system would allow. This section examines how the war is financed, how adaptation has been institutionalised, how drones changed the force, and how training moved between partners abroad, schools at home and units at the front. Most figures are wartime official claims or analyst estimates that cannot be audited, and they are labelled as such.

10.1Budget and finance

Ukraine's military burden is of a different order from any other in this paper. The SIPRI estimates its military expenditure at USD 64.8 billion in 2023, equal to 37 per cent of GDP and 58 per cent of government spending, and at USD 84.1 billion in 2025, a real increase of 20 per cent on 2024, equal to 40 per cent of GDP and 63 per cent of government spending.391, 394 SIPRI data reproduced by BBVA Research put the 2024 share at about 34 per cent of GDP (Figure 10.1).395 These estimates exclude foreign military aid; SIPRI counts financial military assistance in the donors' spending.391

Ukraine spent an estimated 40 per cent of GDP on its military in 2025; with new US aid down 99 per cent, European loans and purchases now carry the load. Adaptation is institutionalised: codified equipment models rose from 110 in 2022 to 2,050 in 2025, about 44 a week in 2026, and drone purchases are now ranked on combat data.

Estimated FPV output rose from a few thousand in 2022 to about 3 million in 2025; skilled crews are scarcer: 170 of over 300 interceptor crews had downed none by April 2026. Training moved home: over 11,000 Ukrainian instructors trained under Interflex now run recruit training, a 51-day basic course adds counter- drone drills, and certified schools reportedly trained over 5,000 drone operators in 2025.

Business Plus Benefit Research · Paper 01 · October 2026 59

Research paper page: The adaptation machine

Text of this page:

Illustration: drone operator training in a classroom of simulators. FIGURE 10.1 Ukraine: military expenditure as a share of GDP, 2023 to 2025

Source: Author's chart from SIPRI fact sheets for 2023 and 2025, and SIPRI data reproduced by BBVA Research for 2024.391, 394, 395Note: SIPRI estimates, rounded; 2023 is from SIPRI's April 2024 release and 2024 and 2025 from its 2026 data, which may revise earlier years; they exclude foreign military aid. For comparison, SIPRI puts Israel at 7.8 per cent in 2025. Shares for 2021 and 2022 were not available in the sources used.

The external money that equips this effort has changed source and form. The Kiel Institute for the World Economy reports that new US aid fell by 99 per cent after 2024, although the United States remains the largest single bilateral donor overall, at EUR 115.4 billion.396 Monthly military aid allocations in July and August 2025 were 43 per cent below the first half of the year, and European allocations 57 per cent lower.397 Europe then recovered: by mid-2026 its military aid had almost returned to the 2025 level, with at least EUR 3 billion spent buying from US defence companies.398 Under the Prioritised Ukraine Requirements List (PURL), launched in 2025 to buy US equipment with Allied money, Allies had committed more than USD 6 billion by June 2026,

according to the NATO, and they pledged EUR 70 billion of military support for 2026.399 European money increasingly buys Ukrainian output. The Ukraine Support Loan of the EU, worth up to EUR 90 billion for 2026 to 2027, assigns EUR 60 billion to defence and the defence industrial base; in October 2026 the European Commission disbursed a further EUR 2.86 billion for drones, air defence and missiles, within EUR 28.3 billion planned for Ukraine's defence industry in 2026, as reported by Ukrinform.400 Domestic revenue goes largely to people. On 13 October 2026 the government allocated an extra UAH 60 billion to the Defence Forces, of which UAH 43.5 billion, about 72 per cent (derived), was for pay and family support, while the Defence Ministry's budget gap was put at USD 27 billion.401 Training is a small line in these flows: the common costs of the EUMAM Ukraine were EUR 106.7 million for its first two- year mandate, and its extension to November 2026 carried nearly EUR 409 million (Section 10.4).402, 403, 404

10.2The adaptation machine

Ukraine has turned adaptation into a measurable process. According to the Ministry of Defence, the number of new military equipment models codified and approved for service rose from 110 in 2022 to 480 in 2023, 1,409 in 2024 and 2,050 in 2025, and reached 1,678 by 25 September 2026, of which 91.2 per cent were Ukrainian- made; 650 uncrewed aerial systems (UAS) were approved in 2026.392 That is about 44 new models a week in 2026 (derived). Codification counts models, not quantities or quality, and a codified model may never be bought at scale. It nonetheless measures the rate at which new equipment, and therefore new training content, enters the force (Section 10.5).

0

10

20

30

40 37%

2023

34%

2024

40%

2025

PercentofGDP(SIPRIestimates)

THE PRICE OF READINESS BUSINESS PLUS BENEFIT RESEARCH

60 Business Plus Benefit Research · Paper 01 · October 2026

Research paper page: Part III. War, money and accountability

Text of this page:

PART III War, money and accountability What the wars in Ukraine and the Middle East have taught about attrition and adaptation, how the new spending will be financed, and how it must be accounted for.

Lessons from current conflicts 13

The economics of attrition: munitions, inter-

ceptors, drones and the training bill 14

Paying for the five per cent: financing readi-

ness in NATO and the EU 15

Accountability in an age of rearmament 16

Research paper page: 13 Lessons from current conflicts

Text of this page:

13

PART III · WAR, MONEY AND ACCOUNTABILITY Lessons from current conflicts Four theatres since 2022 show the same pattern: cheap mass at industrial volume, adaptation measured in weeks, and defence paid for in scarce interceptors and scarce operators. Each has direct consequences for what forces must train, how often and at what cost.

IN BRIEF

8,161 Shahed-type launches at Ukraine in May 2026, the record month; unaudited Ukrainian Air Force data521

7,780 Iranian missiles and drones fired in the 2026 war (JINSA estimate)522

50% Fall in Suez Canal transits from 2023 to 2024, official statistics523

This section draws lessons for training from four theatres: the drone war in Ukraine; the exchanges between Israel and Iran from April 2024 to the war of 2026; the Houthi campaign against Red Sea shipping; and the conflict between India and Pakistan in May 2025 (Figure 13.1). The evidence is uneven and is graded accordingly. Ukrainian launch and interception counts are unaudited wartime claims compiled by third parties; Israeli, Iranian, Indian and Pakistani figures are partly political and often contested; and most US munitions data are analyst reconstructions rather than official counts. Section 14 develops the economic consequences.

13.1Ukraine: volume, adaptation and electronic warfare

Russia's long-range drone campaign is the clearest case of volume used as a weapon. The CSIS found that launches of Shahed-type one-way attack drones rose from about 130 a week before September 2024 to more than 1,000 a week by March 2025.524 Ukrainian Air Force data compiled by the Institute for Science and International Security record 54,538 Shahed-type launches in 2025, about 59 per cent of them strike drones and the rest decoys; the largest attack of the year, on 7 September 2025, comprised 823 air attack vehicles, including 810 Shahed-type drones.525 Monthly launches rose from 2,629 in January 2025 to a record 8,161 in May 2026, more than three times as many (Figure 13.2).521

Shahed-type launches at Ukraine rose from 2,629 in January 2025 to a record 8,161 in May 2026; most were shot down or suppressed, yet over 7,000 drones hit their targets in 2025. Russia changed the threat within one quarter: jet- powered Gerans grew from about 1 per cent of strike drones in May 2026 to an estimated 57 to 62 per cent in August.

Iranian salvos grew from over 300 projectiles in April 2024 to an estimated 7,780 in 2026; CBO estimates the United States used one-half to two- thirds of key interceptor stocks since June 2025. Suez transits halved in 2024 and did not recover in 2025. Ten lessons follow, led by training for volume, electronic warfare as the default and threat libraries refreshed at operational tempo.

Business Plus Benefit Research · Paper 01 · October 2026 75

Research paper page: 14 The economics of attrition

Text of this page:

14

PART III · WAR, MONEY AND ACCOUNTABILITY The economics of attrition: munitions, interceptors, drones and the training bill Attrition prices readiness twice: in the munitions and interceptors consumed in war, and in the live training those stocks can no longer support. Cost-exchange ratios, magazine depth and the scarcity of trained operators now set the training bill.

IN BRIEF

21.7USD bn

Cost of replacing US munitions expended against Iran to 1 August 2026, of which USD 13.1 billion for interceptors (CBO estimate)572 5.4years

FY2026 THAAD purchases consumed in the 2026 war (derived from JINSA estimates)573 85F-35A hours

Equal in cost to one live AMRAAM shot at FY2026 reimbursable rates (derived)574, 575

Section 13 described what the current wars consume; this section prices it. It defines the cost-exchange ratio and derives ratios from the available estimates (14.1), sets the expenditure of interceptors and shells against production (14.2), examines the trained operator as the scarce input (14.3) and the effect of attrition on live training (14.4), and prices an illustrative training bill (14.5). Unit costs are labelled official or estimate, every derived figure is shown with its inputs, and none is an audited cost. 14.1Cost-exchange ratios: definition and evidence

A cost-exchange ratio divides what the defender spends to defeat a threat by what the attacker spends to launch

it; above one, defence costs more than attack. Calculated per shot, the ratio understates the defender's cost, because two interceptors are often fired at one threat, and it omits launchers, radars and crews. It also omits what is defended. The CSIS argues that a cost per intercept says nothing about the value of the ship or city protected, and finds that US defensive missiles are on average roughly twice as expensive as offensive ones.576 The ratio is therefore a test of sustainability, not of whether a defence is worth having.

At USD 4 to 5.3 million, a PAC-3 MSE fired at a Shahed-type drone costs 80 to 265 times its target; Iron Dome and interceptor drones sit near or below parity. The 2026 war consumed about 3.5 years of FY2026 PAC-3 purchases and 5.4 of THAAD on JINSA's counts; agreements signed in 2026 aim to triple or quadruple output within seven years.

The trained operator is the scarce input: in April 2026, 170 of more than 300 Ukrainian Air Force interceptor drone crews reportedly had yet to destroy a single Shahed. Illustratively, one live AMRAAM equals about 85 F-35A flying hours and one PAC-3 MSE 215 to 285: high-end weapons employment should be trained mainly in simulation.

82 Business Plus Benefit Research · Paper 01 · October 2026

Research paper page: Threats and interceptors, priced

Text of this page:

Illustration: a ground-based air defence radar at night.

Threat costs are estimates. CSIS put a Shahed-type drone at USD 20,000 to 50,000, and the RUSI estimated that Russian hardening raised the production cost of its version to around USD 80,000.577, 578 Leaked documents reported by The War Zone, whose authenticity it could not confirm, showed a negotiated price of USD 193,000 a drone for 6,000 units, including licence and technology

transfer, and a projected localised cost of about USD 48,800.579 Ukrainian officials estimated a Gerbera decoy at about USD 10,000.580 At the top of the range, the JINSA, an advocacy-oriented think tank, inferred from a claim by Prime Minister Netanyahu that each Iranian medium-range ballistic missile cost at least USD 12 million.581

FIGURE 14.1 Unit costs of threats and interceptors, USD, log scale

Source: Author's chart from CBO, the FY2027 procurement summary (P-1), CSIS, RUSI, JINSA, Globes, the Israel Policy Forum, Military Times and Ukrainian officials.572, 576,

577, 578, 580, 581, 582, 583, 584, 585, 586, 587, 588Note: nominal USD as published, price years 2023 to 2026, not adjusted. Official basis: the PAC-3 MSE upper value (USD 5.3 million, the FY2025 P-1 average including support, derived). All other values are estimates: CBO (Patriot, SM-6, THAAD lower value, SM-3 upper value); CSIS (THAAD upper value, SM-3 lower value, AMRAAM, Shahed-type lower values, SM-2 as cited from the press); RUSI (Shahed-type upper value); JINSA (Arrow upper value; Iranian missile inferred from a political claim); press and Ukrainian official estimates (Israeli interceptors, interceptor drones, Gerbera decoy, Iron Beam marginal cost per shot excluding capital).

Threat Interceptor

1 10 100 1,000 10k 100k 1m 10m 100m

IronBeamlaser(marginalcostpershot) USD3.50to10

Interceptordrone(Ukraine) USD1,000to2,500

Gerberadecoydrone USD10,000

Shahed-typeone-wayattackdrone USD20,000to80,000

IronDomeTamir USD30,000to50,000

David'sSling USD0.7mto1m

AMRAAM(air-to-airmissile) USD1.03m

Arrow2andArrow3 USD1.5mto3.5m

SM-2 USD2m

PAC-3MSE(Patriot) USD4mto5.3m

SM-6 USD4m

SM-3(BlockIBtoIIA) USD9mto28m

THAAD USD12mto15m

Iranianballisticmissile(inferred) USD12mormore

USDperunit,logscale

BUSINESS PLUS BENEFIT RESEARCH ECONOMICS OF ATTRITION

Business Plus Benefit Research · Paper 01 · October 2026 83

Research paper page: 15 Paying for the five per cent

Text of this page:

15

PART III · WAR, MONEY AND ACCOUNTABILITY Paying for the five per cent: financing readiness in NATO and the EU Allied defence budgets are rising fast and the money is real, but it flows mainly to equipment. Neither NATO's 5 per cent commitment nor the EU's instruments finance or measure operations, maintenance and training, and the fiscal space behind the surge is temporary.

IN BRIEF

5.0% of GDP The Hague commitment for 2035, of which at least 3.5% for core defence and up to 1.5% for related spending625

36% Investment share of EU defence spending, 2026, projected, up from 32% in 2025 (EDA data)626

6.55% Greece: 'other' share of defence spending, 2025, the NATO category that contains O&M (NATO estimate)627

This section follows the new money: what the Allies have committed, what the EU adds and what the money buys. The evidence supports four propositions. The money is real and rising fastest where the threat is nearest. It flows mainly to equipment, while the share for O&M, the line that carries exercises and training, is falling in several Allies. No EU instrument finances or targets the operations, maintenance or training of Member States' forces, and no framework of the NATO or the EU measures what the extra money buys in readiness. Finally, much of the fiscal space behind the surge is temporary.

15.1The Hague commitment

At The Hague Summit on 24 to 25 June 2025 the Allies committed to invest 5 per cent of GDP annually by 2035: at least 3.5 per cent on core defence requirements under the agreed NATO definition, and up to 1.5 per cent on defence and security related spending such as critical infrastructure, networks, civil preparedness, innovation and the defence industrial base.625, 628 Allies are to submit annual plans showing 'a credible, incremental path' to the goal, and direct contributions to Ukraine's defence and its defence industry count towards national totals. The declaration is political rather than legally binding and sets no interim milestone.625

The Hague target of 5 per cent of GDP by 2035 counts inputs: only its 3.5 per cent core has a common definition, and nothing measures the readiness bought. NATO estimates, as reported, put the four north- eastern frontline Allies at 4.68 to 5.33 per cent of GDP in 2026 and Greece at 3.65, while ten Allies sit between 2.00 and 2.10.

The money goes to equipment, and no EU instrument finances Member States' operations, maintenance or training; in Greece the operations and maintenance proxy fell to 6.55 per cent of spending in 2025. Fiscal space is temporary: the escape clause runs to 2028 and SAFE loans must be repaid, so the 2029 NATO review should add measures of readiness output.

Business Plus Benefit Research · Paper 01 · October 2026 89

Research paper page: Where the Allies stand

Text of this page:

Illustration: a European institutional quarter at dusk.

The two parts differ in quality. The 3.5 per cent uses NATO's established definition, which includes pensions and, for some Allies, aid to Ukraine.627 The 1.5 per cent basket has no agreed common definition; NATO first reported it in July 2026, on national definitions that are not harmonised.625, 629 The gap already shapes headlines. On 6 July 2026 the Secretary General, Mark Rutte, said that European Allies and Canada were investing around 4 per cent of their GDP in defence and security.630 NATO's estimate of their core spending in 2026, as reproduced by the International Centre for Defence and Security (ICDS), is 2.53 per cent, so roughly 1.5 points of the headline come from the loosely bounded related category (derived).631 The commitment also changes what NATO counts. At the Wales Summit in September 2014 the Allies set two input guidelines: to move towards 2 per cent of GDP within a decade, and to raise spending on major new equipment, including related research and development (R&D), to 20 per cent or more of defence expenditure.632 The Hague text raises the level but sets no guideline for the composition of spending; instead, the trajectory and balance of spending will be reviewed in 2029.625 That review is the one scheduled moment to examine what the money is spent on, and so the natural point at which to add measures of readiness output (Section 15.7).

“The trajectory and balance of spending under this plan will be reviewed in 2029, in light of the strategic environment and updated Capability Targets.

NORTH ATLANTIC TREATY ORGANIZATION, THE HAGUE SUMMIT

DECLARATION, 2025625

The Ankara Summit of 7 to 8 July 2026 reported delivery in cash rather than in shares of GDP. Its six-paragraph declaration states that European Allies and Canada raised their investment in core defence requirements by more than USD 139 billion in 2025 (nominal, partly reflecting exchange rates), announces more than USD 50 billion in new procurements and pledges EUR 70 billion in military equipment, assistance and training for Ukraine in 2026. It does not restate the 5, 3.5 or 1.5 per cent targets, the annual plans or the 2029 review, and its only explicit reference to digital or synthetic capability concerns a transatlantic warfighting cloud and AI models.633

15.2Where the Allies stand

The increase is real. NATO's June 2025 release (data cut-off 3 June 2025, constant 2021 prices) estimated that European Allies and Canada spent 2.27 per cent of their combined GDP on defence in 2025, against 1.40 per cent in 2014, narrowing their gap with the United States from 2.31 to 0.95 percentage points (derived; Section 18).627 Their real spending, which grew by about 3.7 per cent a year in 2015 to 2022 (derived), rose by 9.27 per cent in 2023 and by an estimated 18.59 and

THE PRICE OF READINESS BUSINESS PLUS BENEFIT RESEARCH

90 Business Plus Benefit Research · Paper 01 · October 2026

Research paper page: 16 Accountability in an age of rearmament

Text of this page:

16

PART III · WAR, MONEY AND ACCOUNTABILITY Accountability in an age of rearmament Public accounting standards already treat weapons systems as assets and munitions as inventories. The gaps are implementation capacity, audit that has not kept pace with the money, and performance information. A readiness ledger would let budgets show what they buy.

IN BRIEF

2.9% Share of open NSIP project expenditure audited by IBAN, 2024: EUR 283 million of EUR 9.6 billion (derived)678

4.65USD tn DoD assets under a disclaimer of opinion, FY2025, with 26 material weaknesses reported by the auditor679

89% Share of Greece's 2026 defence appropriation in a single programme, of EUR 7.06 billion (derived)680

This section asks whether the systems that account for, audit and evaluate defence money can show what rearmament buys in readiness. On the evidence available, the accounting standards are largely in place; what lags is the capacity to apply them, the reach of external audit and the performance information that would link budgets to trained outcomes. The evidence comes chiefly from the NATO, the United States, the United Kingdom, the EU and Greece. 16.1Why accountability is a readiness issue

The commitments of 2025 fix inputs, not results. At The Hague, Allies agreed to invest 5 per cent of GDP a year

by 2035, at least 3.5 per cent of it on core defence, and to submit annual plans whose 'trajectory and balance of spending' will be reviewed in 2029.681 The EU's Defence Readiness Roadmap 2030 sets no quantified target for operations, maintenance or training, and tracks training only through an indicator for the EUMAM Ukraine.682 Accountability in the narrow sense, reliable accounts and lawful spending, is therefore necessary but not sufficient: a budget can be fully spent and cleanly audited and still buy little readiness.

NATO bodies' accounts almost always receive clean opinions, yet qualified compliance opinions rose from one in FY2021 to seven in FY2024, while their auditor had 39 per cent of auditor posts vacant. The US Department of Defense, with USD 4.65 trillion of assets, received another disclaimer of opinion for FY2025; its auditor reported 26 material weaknesses and its management 69.

Member States' defence budgets reached EUR 418 billion in 2025, yet the EU's auditor lacks a mandate over all defence bodies and in 2025 found that new instruments need not publish beneficiaries. Greece holds 89 per cent of its 2026 defence appropriation in one programme; accrual accounts reach central government from 2027, but weapons systems were excluded from the initial asset inventory.

96 Business Plus Benefit Research · Paper 01 · October 2026

Research paper page: The standards are ready

Text of this page:

Illustration: financial statements and a ledger.

This paper distinguishes three levels (Sections 1 and 2). Inputs are appropriations and the assets and stocks they buy; outputs are training activity, such as live and simulator hours, sea days and exercises; outcomes are qualified crews and certified units, which together make up the readiness stock. Accounts record inputs and budgets are voted on them, but few of the public documents reviewed for this paper report outputs, and fewer still outcomes. The gap widens in a surge. Transparency International Defence and Security (TI-DS) judges the sector 'especially vulnerable to corruption risks during periods of rapid defence spending',683 and money that arrives faster than it can be used well is where the hollow force begins (Section 15).

16.2The standards are ready

The accounting standards are not the obstacle. In 2015 the International Public Sector Accounting Standards (IPSAS) were amended to use the statistical term 'weapons systems', in place of 'specialist military equipment', for warships, submarines, military aircraft and other equipment used continuously to provide defence services 'even if their peacetime use is simply to provide deterrence'; such systems 'will normally meet the definition of property, plant and equipment'.684, 685 Single-use ammunition, missiles, rockets and bombs are 'military inventories', although some missiles may be accounted for as property, plant and equipment.686 Munitions, spares and airframes are thus at once assets in the accounts and the consumables of training and war (Section 14). The measurement package of 2023 modernised the asset side. IPSAS 45, Property, Plant, and Equipment, and IPSAS 46, Measurement, issued by the International

Public Sector Accounting Standards Board (IPSASB) in May 2023, took effect for periods beginning on or after 1 January 2025; IPSAS 45 replaced IPSAS 17 and added current operational value as a measurement basis.687, 688 Amendments issued in August 2025 bring current operational value into the standards on inventories and on impairment of non-cash-generating assets from 1 January 2028.689 The text of IPSAS 45 was not accessible for this paper, so whether it keeps the IPSAS 17 wording on weapons systems is unconfirmed (Table 16.2). Statistical rules point the same way. The 2008 System of National Accounts treats warships, submarines, military aircraft and tanks as fixed assets and ammunition, missiles, rockets and bombs as military inventories; its Advisory Expert Group agreed in 2012 that losses of weapons systems in military operations should generally be recorded as other changes in the volume of assets, with service lives that reflect expected losses.690 An aircraft or tank lost in combat thus leaves the capital stock outside expenditure, and outside depreciation except where expected losses shortened its assumed life, so neither the deficit nor the cost of ownership fully shows the attrition priced in Section 14. The difficulty lies in applying the standards. In the 2016 accruals survey by the Organisation for Economic Co- operation and Development (OECD) and the International Federation of Accountants (IFAC), 22 of the 28 countries reporting on or moving to accruals recognised defence assets and inventories, and problems with the inventory and valuation of fixed assets, 'in particular, defence equipment', were among the main causes of qualified audit opinions on government accounts.691 The survey predates the rearmament, but later audits suggest that the pattern persists.

BUSINESS PLUS BENEFIT RESEARCH ACCOUNTABILITY

Business Plus Benefit Research · Paper 01 · October 2026 97

Research paper page: Part IV. Synthesis and outlook

Text of this page:

PART IV Synthesis and outlook A comparative cost model, the strategic outlook to 2035, and recommendations for NATO and the European Union.

Comparative synthesis and a cost model for

blended readiness 17

Strategic outlook to 2035 18

Conclusions and recommendations for

NATO and the EU 19

Research paper page: 17 A cost model for blended readiness

Text of this page:

17

PART IV · SYNTHESIS AND OUTLOOK Comparative synthesis and a cost model for blended readiness The states examined in this paper train for war in five recognisable ways. A transparent cost model shows that what blending saves depends far more on how much training can credibly move to synthetic means than on the price of the simulator.

IN BRIEF

The preceding sections examined each alliance and state on its own terms. This section draws them together. It first classifies the training models that emerge from the evidence, then applies the cost model set out in Annex B to show what a deliberate blend of live and synthetic training buys, which parameters matter most, and where the hour is the wrong unit of account altogether.

17.1Five ways to train for war

The classification in Figure 17.1 and Table 17.1 is the author's assessment, based on the evidence in Sections 4 to 12. It describes the dominant pattern in each case rather than every service or branch, and it should be read as a comparison of tendencies, not as a ranking of quality. Simulation-intensive blends combine a mature synthetic layer with demanding live anchors. In the United States, the Naval Air Warfare Center states that tactical groups training in the Joint Simulation Environment fly more sorties in a week than over a year on open-air

ranges, yet the Army's ground operating tempo tables still credit virtual training as zero.731, 732 The Royal Air Force already conducted about half of its combat air training on synthetic devices in 2021 and expects to conduct 80 per cent of all its training synthetically by 2040.733 The Israeli Air Force concentrated its combat simulators in a mission training centre in which, according to an Elbit executive quoted in the press in 2021, half of its training flights were to be conducted, and Globes reported about 15 per cent more simulator sorties before Iran's attack in April 2024.734, 735 Live-anchored blends keep the aircraft, the vehicle and the ship at the centre and use simulators as a complement of roughly a quarter where data exist. French Air and Space Force fighter pilots were forecast in 2022 to fly 147 hours in 2023 against an objective of 180, and the force's Chief of Staff put the need in 2024 at 160 aircraft hours plus about fifty in the simulator; German Eurofighter and Tornado pilots could fly up to 30 of their 70 licence hours in the simulator, and on average a quarter of the Luftwaffe's required hours were syn-

Five training models emerge: simulation-intensive blends, live-anchored blends, combat-adaptive systems, exercise realism with AI ambition, and mass with proxy-war experience. At FY2026 marginal rates, keeping one F-35A pilot at the French 180-hour objective with live flying alone costs about USD 3.35 million a year; delivering half synthetically saves about USD 1.5 million.

The synthetic share drives the result: across its evidence range the saving per pilot-year moves between USD 0.74 and 2.08 million, against USD 0.93 to 1.64 million for military simulator cost ratios. Cost per trained outcome should replace cost per hour: in pilot production, air defence and drone training the decisive costs are pipeline time, war stocks and operator throughput.

104 Business Plus Benefit Research · Paper 01 · October 2026

Research paper page: 19 Conclusions and recommendations

Text of this page:

19

PART IV · SYNTHESIS AND OUTLOOK Conclusions and recommendations for NATO and the EU Readiness is bought one trained outcome at a time. The new money will buy more of it if the Alliance and the Union measure what training produces, credit synthetic training on evidence, protect the live hours that matter and account for readiness as an asset.

IN BRIEF

This paper set out to answer five questions about the price of readiness. This section answers them in turn, using the evidence of the preceding sections, and then sets out recommendations. The recommendations are deliberately specific: each names an owner, a time frame and a measure, because the central finding of the paper is that readiness that is not measured cannot be managed.

19.1Answers to the research questions

(a) What does a unit of combat readiness cost? Not what the flying hour suggests. The marginal cost of a live hour (USD 18,600 for an F-35A at the FY2026 reimbursable rate) is only part of the cost of a trained outcome, which also includes the pipeline time, the airframe life, the instructors and the munitions that each hour consumes.833 RAND estimated that producing a basic qualified fighter pilot cost between USD 5.6 million and USD 10.9 million in FY2018 dollars.834 On the model in Annex B, keeping a fighter pilot at the 180-hour norm cited by the French Parliament by live flying alone costs between about USD 2.7 million and USD 9.9 million a year in mar-

ginal costs depending on the type, and a blend that delivers half of the requirement synthetically saves about 44 per cent of that sum whatever the type, or about 48 per cent if each simulator hour is credited hour for hour (Section 17 and Annex B). (b) What does the evidence say about transfer, and where does synthetic training fail? Synthetic training transfers well for individual procedural skills, instrument flying and weapons delivery, with a median transfer effectiveness ratio of about 0.45 across the classic studies; its value diminishes with each additional hour, and it fails, or remains unproven, for physiological stress, live fire, collective friction and much of air combat (Section 3).835 The evidence for drone operators, a fast-growing training population, is thin. (c) How do the major powers allocate between live and synthetic, and why? Five models emerge (Section 17): simulation-intensive blends in the United States, the United Kingdom and Israel; live-anchored blends in most of the European and Indo-Pacific allies examined and in India (in France and Germany, as in the US Air Force's aircrew requirements, about a quarter of fighter training

A unit of readiness is best priced as a trained outcome; on that basis a deliberate blend of live and synthetic training is markedly cheaper than live training alone, within limits set by evidence. The wars of 2022 to 2026 make live training more expensive and synthetic training more necessary: attrition consumes the same assets, and adaptation runs in weeks.

The new money flows mainly to equipment; no NATO or EU framework yet measures what it buys in readiness. Eleven recommendations, six for NATO and five for the European Union, are set out with owners, timing and measures, followed by an assessment for Greece.

116 Business Plus Benefit Research · Paper 01 · October 2026

Research paper page: The publisher

Text of this page:

THE PUBLISHER Business Plus Benefit Business Plus Benefit Advisory & Systems is an independent advisory firm based in Thessaloniki, Greece. It brings financial governance and systems engineering together for public bodies, international organisations and enterprises, with a particular focus on defence, on organisations of the North Atlantic Treaty Organization (NATO) and on the funding instruments of the European Union.

BUSINESS PLUS BENEFIT RESEARCH Business Plus Benefit Research publishes evidence-based papers on defence economics, NATO and European Union funding, public financial management and strategic analysis. Each paper asks a question that matters to those who plan, fund, deliver and audit public programmes, and answers it from open sources. The papers follow a common discipline: every factual statement is referenced in Harvard style, the strength of the evidence is graded and stated, models are kept simple enough for their assumptions to be seen and challenged, and every figure is checked against its source before publication.

WHY THE PRICE OF READINESS Readiness is where defence policy, public finance and accountability meet. This first paper applies the firm's core disciplines, costing, budgeting, accounting and audit, to the question that the new defence spending raises: what each euro and dollar buys in trained and ready forces, and how that can be measured and reported.

WORKING WITH US The firm's services are designed for ministries, armed forces, NATO bodies and Centres of Excellence, international organisations and enterprises, and are delivered in Greek and in English. Enquiries about advisory work, research and permissions are welcome through the website.

Business Plus Benefit Advisory & Systems

Thessaloniki, Greece

www.businessplusbenefit.com

WHAT WE DO

01 Public financial management and IPSAS Financial governance, budgeting and the transition to International Public Sector Accounting Standards (IPSAS): maturity assessments, transition studies, accounting policies and support for financial statements and audit.

02 Defence and international organisations Budget execution, commitment of funds, financial control and audit readiness for defence bodies, NATO-accredited organisations and other international organisations, built on first-hand experience of military finance.

03 European Union funding Funding strategy, applications and programme management for public bodies and enterprises seeking support from European Union instruments, from eligibility analysis to reporting and audit.

04 Accounting systems and automation Accounting applications, budget execution and commitment-of-funds tools, finance process automation, technical support and training, designed around the controls that public and international bodies must meet.

Business Plus Benefit Research · Paper 01 · October 2026 161

Research paper page: Back cover

Text of this page:

Readiness is bought one trained outcome at a time.

BUSINESS PLUS BENEFIT RESEARCH · PAPER 01 The Price of Readiness Live and Synthetic Training, Attrition and the Financing of Allied Defence

What does a unit of combat readiness cost when it is produced in the air, on the range, in the simulator or in a blend of all three? This paper brings together the evidence on cost, on the transfer of training and on attrition in the wars in Ukraine and the Middle East.

It compares how NATO, the European Union and fifteen states train, examines how the new 5 per cent commitment will be financed and accounted for, and sets out quantified recommendations for allied training policy to 2035, with an assessment for Greece.

0.45 Median transfer effectiveness ratio of simulator training in the classic studies

44% Saving in marginal costs from delivering half of a fighter pilot's training synthetically (central case)

1,200 PAC-3 interceptors estimated to have been used against Iran in 2026, more than three times FY2026 purchases

11 Recommendations for NATO and the European Union, with an assessment for Greece

Business Plus Benefit Advisory & Systems

Thessaloniki, Greece

www.businessplusbenefit.com

© 2026 Business Plus Benefit Advisory & Systems. All rights reserved. No part of this publication may be reproduced, stored or transmitted in any form without the prior written permission of the author.

Cover

Selected pages: 32 of 162.Ask about this research

Need a study your board can decide on?

Tell us the question in front of you. We reply within 2 working days.

We respond to RFP and RFQ invitations.

Start a conversation

Tell us about your box.

What you are working with, and where it pinches. We reply within 2 working days.

Fields marked * are required. We work with businesses and public bodies (B2B and B2G). We use your details only to reply to your enquiry. Cloudflare Turnstile checks that the form is sent by a person. See the privacy notice.

Cookie settings

Choose what this website may load.

Necessary

Three small values kept in your browser, never sent to us: your choice here, that the opening animation has played, and "Pause animations" if you use it. No cookies. When you use the contact form, Cloudflare Turnstile checks that a person is sending it.

Always on

External media: YouTube

The demo film plays in YouTube’s privacy-enhanced player, which sets cookies and similar storage of its own (Google). If you do not allow it here, nothing is loaded from YouTube until you press play and confirm.

More in our privacy notice.